
Best Practices for Apparel Key Account Performance Dashboards in 2026
In 2026's hyper-competitive apparel landscape, key account performance dashboards are no longer optional—they're a strategic imperative. With consumer preferences shifting rapidly and retail partners demanding data-driven collaboration, brands that master dashboard-driven account optimization gain a decisive competitive edge. Real-time data visualization transforms key account management from reactive firefighting to proactive partnership building.
Practical steps to implement:
- Integrate POS data, inventory levels, and sell-through rates in real-time dashboards
- Set up automated alerts for underperforming SKUs or account-level anomalies
- Create visualizations that highlight margin performance by account and category
- Benchmark key accounts against regional and national averages
By leveraging dashboards that provide instant visibility into account health, apparel brands can anticipate issues before they impact revenue, optimize assortments based on actual performance data, and strengthen relationships with retail partners through data-backed insights. The result: higher sell-through rates, improved margins, and sustainable competitive advantage in an increasingly crowded market.
Core Metrics: What to Track for Apparel Key Account Success
For apparel key account success in 2026, tracking the right metrics is crucial for informed decision-making. These metrics provide insights into sales performance, inventory efficiency, and customer engagement, enabling brands to optimize their account strategies. Focus on these core metrics across three critical areas:
Sales Performance:
- Sell-through rates: Monitor weekly to identify slow-moving SKUs; aim for 70%+ sell-through within 8 weeks of launch. Tip: Compare rates across channels (e.g., wholesale vs. DTC) to optimize allocation.
- Average order value (AOV): Track monthly; implement upselling strategies (e.g., bundle offers) to boost AOV by 15%+. Checklist: Analyze AOV by account tier to tailor incentives.
- Seasonal trends: Use year-over-year analysis to forecast demand; adjust inventory 3 months ahead based on historical peaks (e.g., holiday spikes).
Inventory & Supply Chain:
- Stock turnover: Calculate quarterly; target 4-6 turns annually to minimize deadstock. Practical step: Automate reorder points for top-selling items.
- Fulfillment efficiency: Measure order-to-ship time; aim for <48 hours. Hint: Integrate with 3PL dashboards for real-time tracking.
- Drop shipping performance: Track fill rates and return rates; partner with suppliers achieving >95% fill rates to reduce stockouts.
Customer Engagement:
- Repeat purchase rates: Monitor quarterly; implement loyalty programs to increase repeats by 20%+. Tip: Segment by customer lifetime value for targeted campaigns.
- Product adoption patterns: Analyze new product sell-through within 30 days; use A/B testing on product pages to boost adoption.
- Promotional effectiveness: Measure ROI on discounts; focus on promotions driving >3x ROI to maximize margin impact.
Dashboard Design Principles for Maximum Impact
In 2026, apparel key account dashboards must move beyond generic templates to become strategic assets. Start with customization that reflects your brand DNA—use your color palette, typography, and visual language to create instant recognition. More importantly, tailor each dashboard to specific account needs: luxury retailers need different KPIs than mass-market chains. Create modular templates that can be reconfigured for each partner.
Real-time integration is non-negotiable. Connect directly to POS systems, inventory databases, and social listening tools to provide up-to-the-minute insights. Set automated alerts for stockouts, sudden sales spikes, or competitor promotions. The best dashboards in 2026 will update every 15 minutes, not daily.
Design for action, not just observation. Use visualization techniques that highlight opportunities: heat maps showing underperforming regions, trend lines predicting stock depletion, and side-by-side comparisons with competitor performance. Include one-click action buttons—"Reorder Now," "Launch Promotion," "Contact Buyer"—that trigger immediate responses. Every metric should answer "So what?" and "What next?"
Practical checklist:
- Brand audit: Ensure dashboard reflects brand guidelines
- API inventory: List all data sources needing real-time connection
- Action mapping: For each KPI, define possible responses
- Mobile optimization: 60% of account managers access dashboards on mobile
- Permission tiers: Different views for executives vs. field teams
Competitive Intelligence Integration: Learning from Market Leaders
Integrating competitive intelligence into your key account dashboards transforms reactive monitoring into proactive strategy. Here's how to learn from market leaders in 2026:
Monitor Competitor Feature Launches: Track new dashboard features like AI-driven predictive analytics, real-time sustainability metrics, or hyper-personalized account views. Set up alerts for competitor product announcements and analyze adoption patterns among shared key accounts. For example, RivalSense tracked that Tapstitch announced on March 13 that it will launch new custom branding features in April, bring back Tuesday drops with 10-20 new blanks weekly, and release camo drops soon. This type of insight is valuable because it helps you anticipate market trends and adjust your product offerings accordingly.

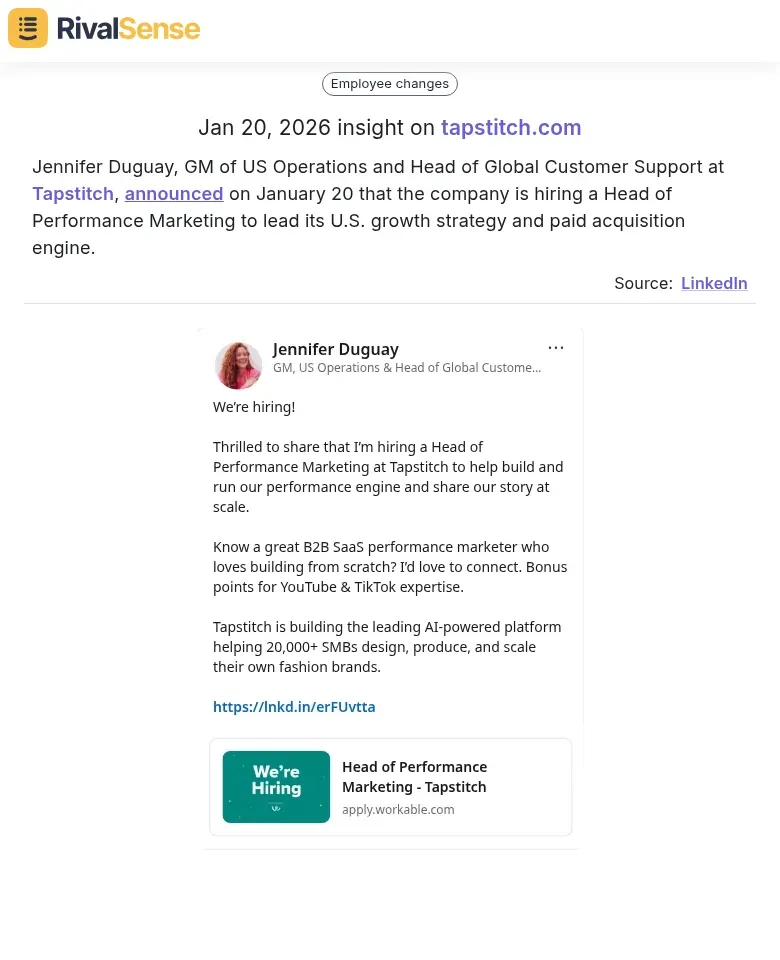
Analyze Hiring Patterns: Watch for strategic hires in data science, AI integration, and key account management roles. When competitors bulk-hire sustainability analysts or predictive modeling specialists, they're signaling investment priorities. For instance, RivalSense captured that Jennifer Duguay, GM of US Operations and Head of Global Customer Support at Tapstitch, announced on January 20 that the company is hiring a Head of Performance Marketing to lead its U.S. growth strategy and paid acquisition engine. Insights into hiring patterns are crucial as they reveal competitors' strategic focus areas, allowing you to benchmark your talent acquisition and skill development.
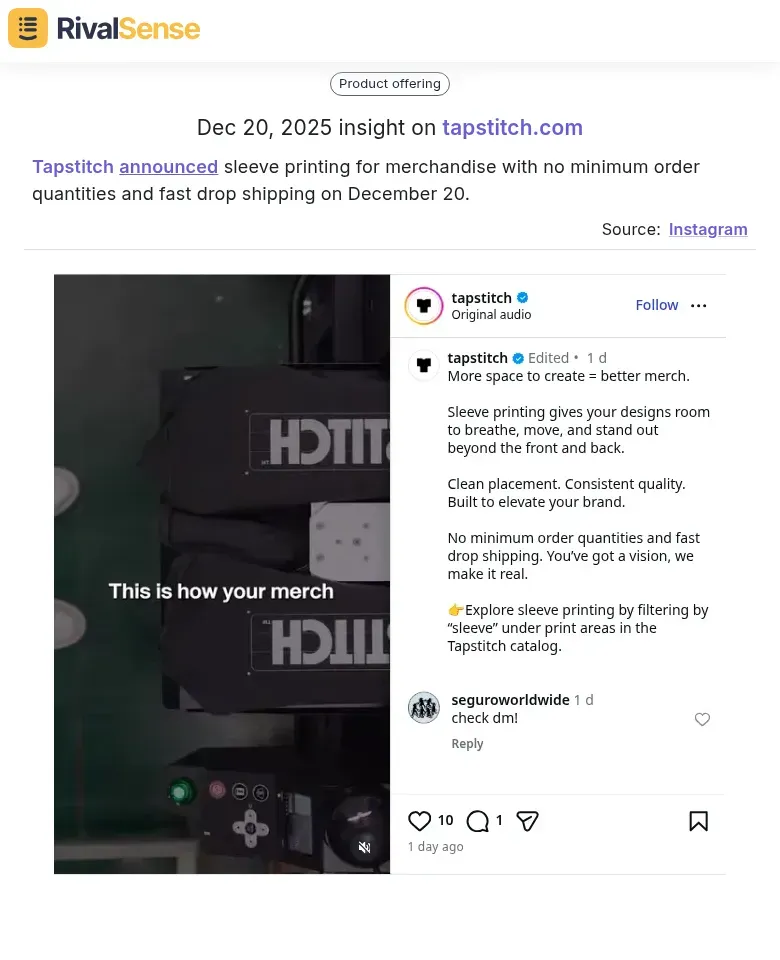
Track Operational Changes: Observe how competitors restructure account management teams, implement new reporting cadences, or introduce automated insights. When market leaders shift from monthly to weekly dashboard updates or adopt real-time inventory integration, these signal emerging best practices. As an example, RivalSense reported that Tapstitch announced sleeve printing for merchandise with no minimum order quantities and fast drop shipping on December 20. Monitoring such operational changes helps you stay agile and adapt your processes to maintain competitive parity or gain an edge.
Implementation Framework:
- Dedicate 15% of dashboard real estate to competitive intelligence widgets
- Establish monthly competitive review meetings with key account teams
- Create a shared competitive insights repository accessible to all stakeholders
- Set up automated alerts for competitor announcements and hiring spikes
By systematically integrating these signals, you'll anticipate market shifts before they impact your key account performance, enabling proactive strategy adjustments rather than reactive responses.
Implementation Strategy: From Dashboard Design to Account Growth
A successful dashboard implementation requires a strategic rollout. Begin with 3-5 pilot accounts representing different segments (e.g., large retailers, specialty boutiques). Use this phase to validate metrics like sell-through rates, inventory turnover, and promotional effectiveness. Document ROI improvements—one brand saw a 15% sales lift within 90 days by optimizing assortments based on dashboard insights.
Training is critical for adoption. Conduct hands-on workshops where account managers practice interpreting data visualizations and creating action plans. Develop a quick-reference guide with common scenarios: e.g., identifying underperforming SKUs or spotting regional demand shifts. Tip: Pair new users with experienced mentors for the first month.
Establish continuous optimization through quarterly feedback sessions. Gather input from account managers on metric relevance and visualization clarity. Use A/B testing for dashboard layouts—one company improved decision speed by 30% by switching to a heatmap view for inventory aging. Checklist: 1) Review key metrics alignment with business goals quarterly, 2) Update data sources for accuracy, 3) Solicit user feedback via short surveys. This iterative approach ensures your dashboard evolves with market dynamics, driving sustained account growth.
Future-Proofing: Preparing for 2026 and Beyond
As we approach 2026, future-proofing your apparel key account dashboards requires strategic integration of emerging technologies and scalable architectures. Here's how to prepare:
AI & Predictive Analytics Integration
- Implement machine learning models that analyze historical sales data, seasonal trends, and market signals to forecast account performance 3-6 months ahead
- Set up automated alerts for predicted inventory shortages or demand spikes before they impact service levels
- Use natural language processing to analyze buyer feedback and social sentiment for early warning signs
Mobile-First Optimization
- Design dashboards with responsive layouts that prioritize key metrics (sell-through rates, margin performance, inventory turns) on smaller screens
- Enable push notifications for critical threshold breaches (e.g., stockouts, payment delays)
- Incorporate touch-friendly controls for quick approval workflows during market visits or trade shows
Scalability Architecture
- Adopt modular dashboard components that can be easily reconfigured as you add new product categories or account tiers
- Implement cloud-based data pipelines that automatically accommodate new data sources (e.g., sustainability metrics, RFID tracking)
- Establish clear governance protocols for dashboard access as your account management team expands
Actionable Checklist for 2026 Readiness:
- Pilot predictive models with your top 3 accounts by Q3 2025
- Conduct mobile usability testing with field sales teams
- Document data integration requirements for planned product expansions
- Schedule quarterly dashboard reviews to incorporate emerging metrics (circularity scores, carbon footprint tracking)
By embedding these forward-looking capabilities now, you'll create dashboards that evolve alongside your business and market dynamics.
Leverage Competitive Insights with RivalSense
To effectively implement the competitive intelligence strategies discussed, consider using a tool like RivalSense. RivalSense tracks competitor product launches, pricing updates, event participations, partnerships, regulatory aspects, management changes, and media mentions across company websites, social media, and various registries. It delivers all these insights in a weekly email report, helping you stay ahead of market shifts.
For example, by monitoring competitors like Tapstitch, you can gain valuable insights into their feature launches, hiring patterns, and operational changes, as shown earlier. This allows you to anticipate trends and adjust your strategies proactively.
Ready to enhance your key account dashboards with real-time competitive intelligence? Try out RivalSense for free at https://rivalsense.co/ and get your first competitor report today!
📚 Read more
👉 Market Entry Competitor Insights: 7 Critical Mistakes Key Account Managers Must Avoid
👉 Real-World Competitor Loyalty Program Analysis: Leveraging Internet Insights
👉 2026 Print-on-Demand Benchmarking: Uncover Competitor Innovation Advantages
👉 SaaS Product Offering Analysis Framework: Turn Competitor Insights into Strategy