
Track Competitor Market Cap Signals via Facebook: A Step-by-Step Guide
Financial filings are lagging indicators. By the time a quarterly report drops, your competitor has already pivoted, scaled, or stalled. Facebook offers a real-time window into their market cap trajectory through organic signals: hiring surges, ad spend shifts, leadership changes, and community engagement patterns. A sudden spike in job postings for AI roles or a new executive hire can signal a strategic pivot that will impact valuation months before analysts catch on. Similarly, a drop in ad frequency or page engagement often precedes a down round or restructuring.
This guide walks you through a practical, step-by-step approach to extracting these signals:
- Identify key competitor pages and monitor post frequency, engagement rates, and employee growth.
- Track leadership announcements and product launches.
- Correlate ad spend changes with hiring bursts.
- Cross-reference with external funding news.
Use a simple spreadsheet to log weekly observations—three data points over a month reveal more than a 10-K. Pro tip: Set up Facebook Page notifications for your top three competitors to catch moves in real time.
Step 1: Identifying the Right Facebook Assets to Monitor
To effectively track competitor market cap via Facebook, start by pinpointing the assets that hold the most valuable signals.
1. Official Company Pages – Your primary source. Look for the verified blue checkmark. Monitor posts about earnings, product launches, partnerships, and leadership changes. Sudden spikes in engagement or negative comments can hint at market sentiment shifts.
2. Executive Profiles – CEOs, CFOs, and VPs often share candid insights. Follow their personal pages for hints about strategy, funding, or internal morale. Tip: Use Facebook’s “Follow” button without sending a friend request.
3. Investor Relations Groups – Many companies host private or public groups for shareholders. Join these to discuss financial results, analyst reports, and Q&A sessions. These groups reveal how investors perceive the company’s value.
4. Industry Communities & Fan Pages – Niche groups (e.g., “SaaS Founders”) and unofficial fan pages often surface competitor news early. Monitor sentiment here—angry customers or excited fans can precede stock moves.
5. Competitor Ad Libraries – Facebook’s Ad Library shows all active ads. Analyze ad spend, messaging, and targeting. A sudden increase in ad volume might signal a fundraising round or product push.
Setting Up Monitoring – Create a private Facebook List (e.g., “Competitor Watch”) and add all identified pages. Use Facebook’s “See First” setting to prioritize their posts. For automated alerts, pair with a tool like RivalSense to get notifications on key changes—no manual scrolling needed.
Checklist:
- [ ] Verified company pages added
- [ ] Top 3 executives followed
- [ ] 2–3 investor groups joined
- [ ] Ad Library bookmarked
- [ ] Facebook List created & alerts configured
Step 2: Extracting Market Cap Signals from Posts and Announcements
Once you've identified your competitors’ Facebook pages, the real work begins: extracting market cap signals from their posts and announcements. Here’s how to decode three key signal types.
1. Product Launches & Feature Updates 🚀
New features often hint at revenue growth or pricing power. For example, when LastPass announced credential management for EBC Financial Group, it signaled a move into high-value enterprise segments. Why this matters: Product expansions targeting larger clients often precede ARR increases and positive market reactions.
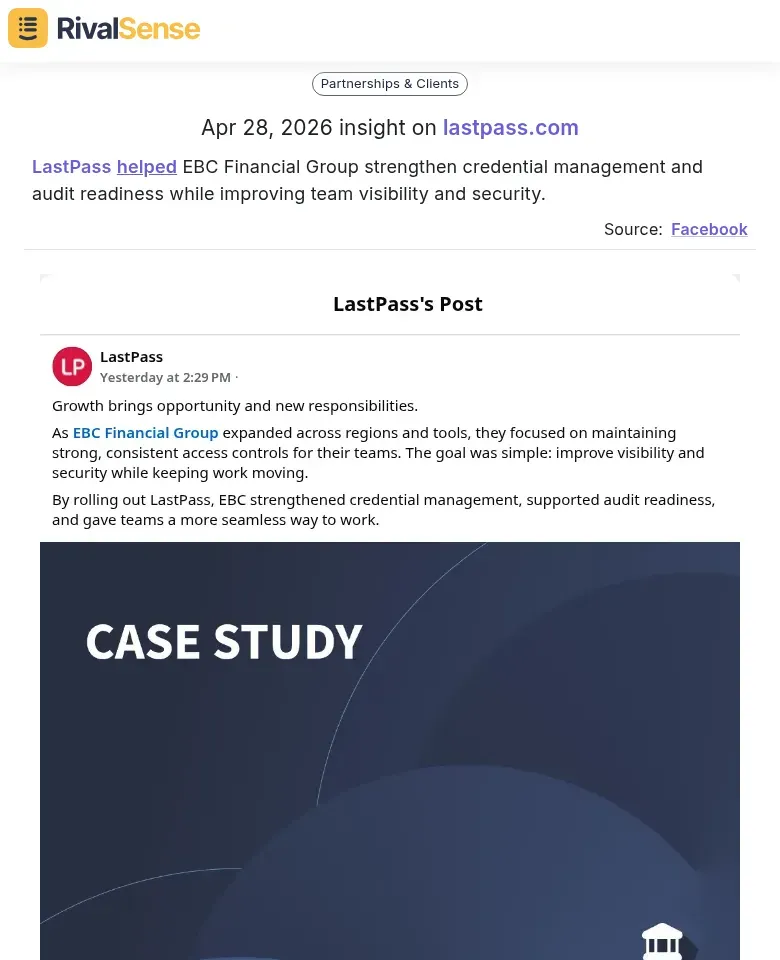
Tip: Look for posts highlighting 'premium' or 'enterprise' tiers—these often precede revenue jumps.
2. Partnerships & Event Announcements 🤝
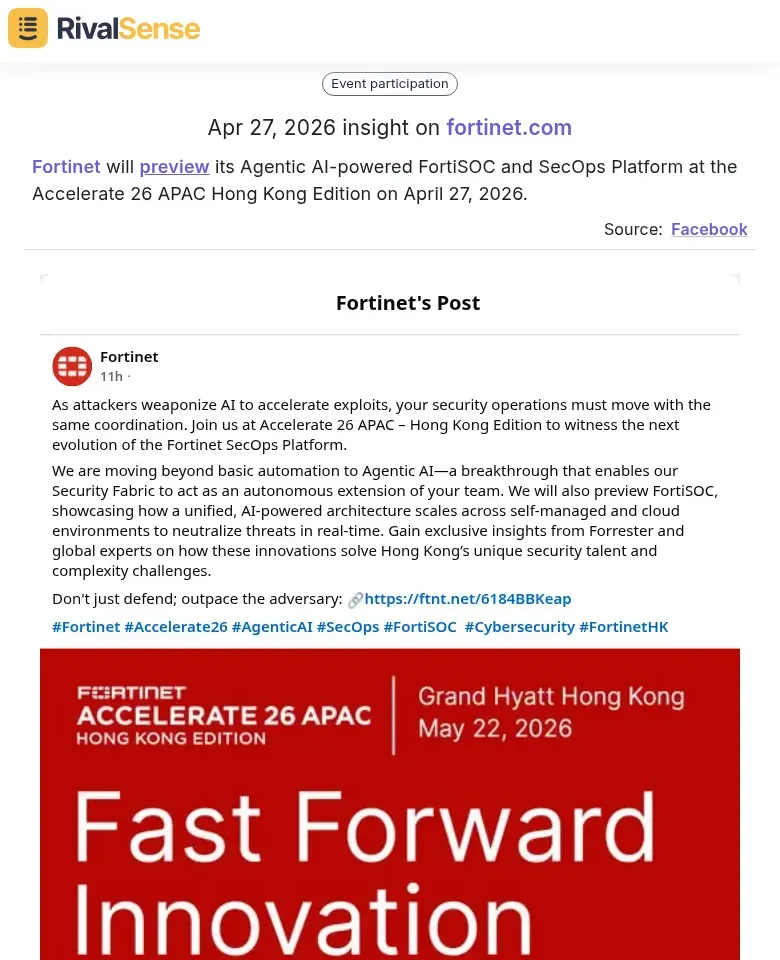
Strategic alliances can indicate market expansion. Fortinet’s preview of Agentic AI at Accelerate 26 suggests they’re targeting AI-driven security markets. Why this matters: Partnerships with global players expand distribution networks and can directly impact valuation.
Checklist:
- Note partner’s size, geography, and industry
- A partnership with a global player often means expanded distribution
3. Content Licensing & Media Deals 🎬
Media deals reveal reach and user engagement. Crunchyroll’s announcement of new anime titles at CCXP Mexico points to a growing Latin American subscriber base. Why this matters: Content acquisitions signal user retention and market penetration—key drivers of subscriber-based valuations.

Hint: Compare post engagement (likes, shares) on these announcements—higher engagement often correlates with stronger market traction.
Actionable Step: Create a spreadsheet with columns for date, signal type, post summary, and estimated impact. Review weekly to spot trends before they hit earnings reports.
Step 3: Correlating Facebook Signals with Market Cap Movements
Now that you've captured Facebook signals, it’s time to link them to market cap shifts. Here’s how:
1. Map Announcement Timing to Valuation Changes
- Log exact date/time of each Facebook post (product launch, leadership change, earnings hint).
- Overlay with stock price or private valuation data (use Yahoo Finance, PitchBook).
- Checklist: Did the market react within 24–48 hours? A lag may indicate noise.
2. Use Engagement as a Sentiment Proxy
- High likes + shares = positive sentiment; heated comments = controversy.
- Calculate an engagement ratio: (likes + shares) / comments. A high ratio suggests approval; low ratio signals debate.
- Tip: Track trends over weeks, not single posts. A sudden spike in negative comments often precedes a dip.
3. Cross-Reference with Financial News & Analyst Reports
- Pull headlines from Bloomberg, Reuters, or Seeking Alpha around same dates.
- Compare Facebook sentiment with analyst upgrades/downgrades. If both align, the signal is stronger.
- Pro hint: Use Google Alerts for the competitor’s name + “analyst” to automate this.
Example: A competitor posts about a new AI feature → engagement is 4x normal → next week, an analyst raises price target → market cap jumps 5%. That’s a validated signal.
Final checklist:
- [ ] Timestamped Facebook events
- [ ] Engagement metrics (likes, shares, comments)
- [ ] Stock/valuation data
- [ ] News & analyst cross-reference
Step 4: Building a Competitive Intelligence Dashboard
Now that you've collected Facebook data on competitor market cap mentions, it’s time to build a centralized dashboard that combines this intel with other sources.
Step 1: Aggregate Data Sources
Pull in Facebook posts alongside SEC filings (via EDGAR), news alerts (Google Alerts, Crunchbase), and social listening tools (Brandwatch, Sprout Social). Use a tool like Airtable, Notion, or a BI platform (Tableau, Power BI) to merge feeds. Create a unified table with columns: date, source, competitor, metric (e.g., market cap, milestone), and sentiment.
Step 2: Build Visual Timelines
Plot competitor milestones (product launches, funding rounds) and market cap trends on a timeline. Use a Gantt chart or line chart to spot correlations—e.g., a market cap spike after a Facebook announcement of a new partnership. Tools like Google Data Studio or Metabase can auto-update from your aggregated data.
Step 3: Automate Keyword Alerts
Set up alerts for trigger words: "partnership," "new product," "expansion," "acquisition." In your dashboard, use conditional formatting or notification rules (e.g., Slack webhooks) to flag posts containing these terms. For example, if a competitor posts about a "strategic partnership," your dashboard highlights it and sends an alert.
Pro Tip: Tag each alert with urgency (low/medium/high) based on keyword combinations—e.g., "partnership" + "$1B" = high urgency.
Checklist:
- [ ] Data sources connected
- [ ] Unified schema created
- [ ] Timeline chart built
- [ ] Keyword alerts configured
- [ ] Notification channel set up
Conclusion: Turning Facebook Insights into Strategic Action
Competitor market cap signals from Facebook can sharpen your strategic edge. When a rival’s valuation surges, investigate the catalyst—new product buzz, leadership changes, or viral campaigns—and assess if you can replicate or counter it. Conversely, a dip may reveal vulnerabilities to exploit or avoid.
Best practices for ethical CI:
- Use only public Facebook data (Pages, Groups, Ads Library).
- Never misrepresent identity or scrape non-public info.
- Document sources to ensure accuracy and auditability.
Next steps for a broader CI framework:
- Set up monitoring cadence – Weekly Facebook page checks, monthly ad library reviews.
- Integrate signals – Combine Facebook insights with other sources (Crunchbase, SEC filings, news).
- Create an action log – Track each signal, your interpretation, and resulting decision.
- Review quarterly – Assess which signals correlated with actual market moves.
Checklist for your CI workflow:
- [ ] Identify 3–5 key competitors to monitor on Facebook.
- [ ] Bookmark their Pages and Ads Library URLs.
- [ ] Set calendar reminders for weekly scans.
- [ ] Create a shared spreadsheet to log observations.
- [ ] Schedule monthly team review of findings.
By weaving Facebook-derived market cap signals into your CI system, you transform raw data into proactive strategy—staying ahead without crossing ethical lines.
➡️ Ready to automate competitor tracking? Try RivalSense for free and get your first competitor report today. Stop manual scrolling—let RivalSense deliver product launches, pricing updates, partnerships, and more straight to your inbox every week.
📚 Read more
👉 How to Perform a Competitor SWOT Analysis in Nanotech
👉 Key Account Metrics from Competitor Events: A Cheat Sheet
👉 How a Single Product Page Update Revealed Sierra's Strategic Pivot
👉 Key Account Tracking Automation: A Practical Guide
👉 How to Turn Competitor Intelligence into a Growth Engine for Your B2B Company