
The Competitor Financial Intelligence Cheat Sheet: Decoding Funding, M&A, and Analyst Signals
Financial and M&A moves are often the earliest indicators of a competitor’s strategic direction. A funding round, acquisition, or even an analyst upgrade can signal where they’re placing their bets—and where you need to watch out. Tracking these signals gives you a crucial early warning system.
Why this matters:
- 💰 Funding rounds (seed, Series A–C, debt financing) reveal growth stage, cash runway, and investor confidence. A large Series B might mean aggressive hiring or market expansion.
- 🤝 M&A activity (acqui-hires, tech acquisitions, bolt-on buys) shows capability gaps they’re filling. If a rival buys a small AI startup, expect AI features soon.
- 📈 Analyst sentiment (upgrades, price targets) reflects market confidence and can predict future resource allocation. Multiple upgrades often precede a hiring spree or marketing push.
- 🏆 Revenue milestones (ARR hitting $10M, profitability inflection) indicate scaling success or pivot validation.
Practical steps:
- Set up alerts for funding announcements (Crunchbase, PitchBook) and M&A news (SEC filings, press releases).
- Track analyst ratings on platforms like TipRanks or Yahoo Finance.
- Monitor LinkedIn for hiring surges post-funding—a 50% headcount increase within 3 months suggests aggressive expansion.
- Build a simple spreadsheet mapping each competitor’s financial events to subsequent product launches or market moves.
Pro tip: A competitor’s first institutional round often precedes a product pivot within 6–12 months. Watch for that signal to adjust your roadmap.
Decoding Analyst Upgrades and Stock Movements
When analysts upgrade a competitor’s stock or raise their price target, it’s rarely random. These moves often signal structural growth drivers—like AI infrastructure investments, new product cycles, or market expansion. To decode these signals effectively, you need to look beyond the headline and understand the underlying rationale.
Here’s how to decode them:
-
Track the rationale: Look beyond the rating change. Read the analyst note for keywords like “new product cycle,” “TAM expansion,” or “cost synergies.” This reveals which strategic bets are gaining external validation.
-
Correlate with stock price surges: A 5%+ jump post-upgrade often indicates market alignment with the competitor’s direction. If the surge holds for weeks, it’s a strong signal.
-
Build a watchlist: Use tools like Yahoo Finance or Seeking Alpha to monitor upgrades for your top 5 competitors. Set alerts for price target changes.
-
Infer segment focus: If multiple analysts upgrade a competitor citing “cloud AI growth,” that segment likely has high strategic importance. Adjust your own roadmap accordingly.
Real-world RivalSense examples of analyst upgrades:
Why this type of insight is valuable: Analyst upgrades often come with detailed reasoning that reveals where a competitor is gaining traction. A price target hike or upgrade can indicate structural growth, giving you an early read on their strengths and market perception.
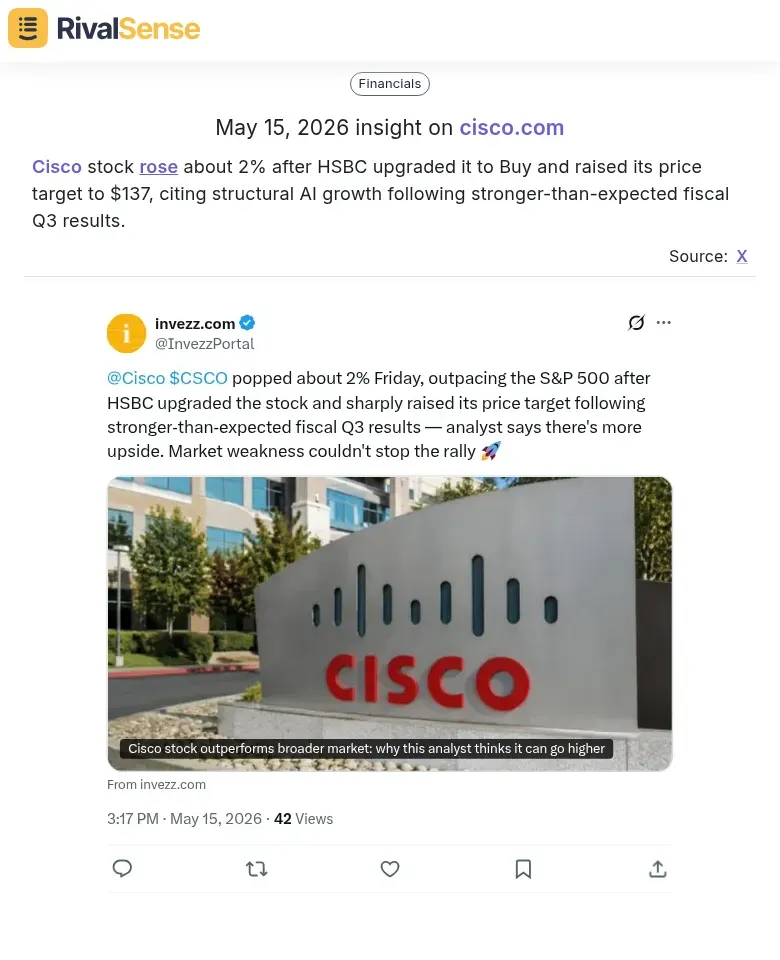
Cisco stock rose about 2% after HSBC upgraded it to Buy and raised its price target to $137, citing structural AI growth following stronger-than-expected fiscal Q3 results.
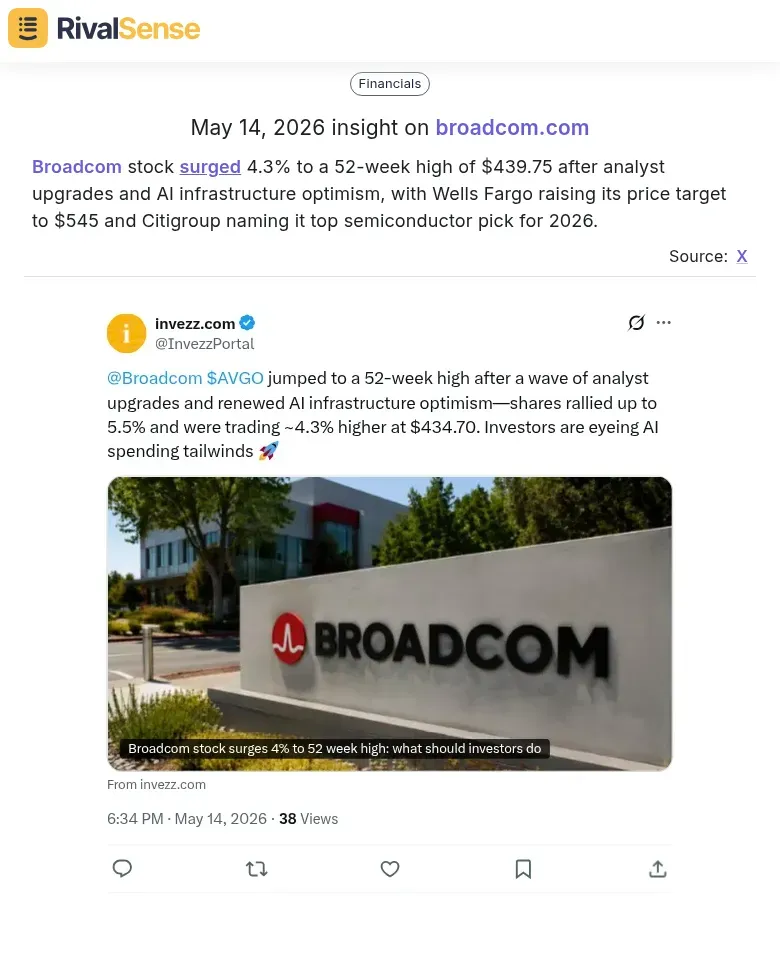
Broadcom stock surged 4.3% to a 52-week high of $439.75 after analyst upgrades and AI infrastructure optimism, with Wells Fargo raising its price target to $545 and Citigroup naming it top semiconductor pick for 2026.
Pro tip: Create a simple spreadsheet tracking upgrade date, analyst firm, rationale keywords, and stock price change. Over time, patterns will emerge—helping you anticipate competitor moves before they’re public.
Revenue and Profitability Inflection Points as Competitive Signals
When a competitor announces record revenue or first-time profitability (e.g., EBITDA positive), it’s a clear signal they have more fuel for aggressive moves—hiring, R&D, or pricing wars. Track these inflection points quarterly. Practical tip: Set alerts for key phrases like “record revenue” or “first profitable quarter” in earnings transcripts and press releases.
Segment-level growth breakdowns reveal where competitors are doubling down. If their SaaS revenue grows 40% but services flatline, they’re pivoting to software. Action step: Map each competitor’s reported segments against your own to spot gaps or threats.
Year-over-year revenue acceleration (e.g., 20% growth in Q1, then 30% in Q2) signals successful scaling and potential market share gains. Checklist:
- [ ] Compare YoY growth rates for the last 4 quarters.
- [ ] Note any inflection points (e.g., from negative to positive).
- [ ] Correlate with product launches or pricing changes.
Use these signals to adjust your own strategy—whether to defend, invest, or differentiate.
Real-world RivalSense example of a profitability milestone:
Why this type of insight is valuable: A competitor’s first-ever profit in a key segment (like Rakuten Mobile) signals that their heavy investments are paying off. It often precedes a more aggressive go-to-market strategy, including pricing changes or expanded marketing spend.
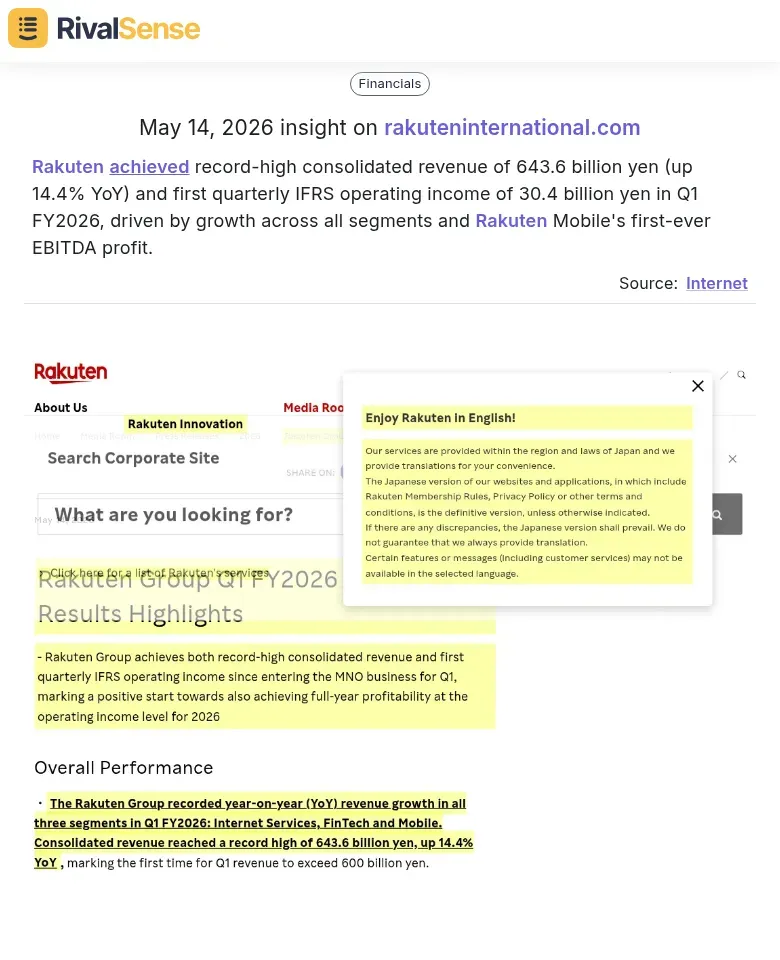
Rakuten achieved record-high consolidated revenue of 643.6 billion yen (up 14.4% YoY) and first quarterly IFRS operating income of 30.4 billion yen in Q1 FY2026, driven by growth across all segments and Rakuten Mobile’s first-ever EBITDA profit.
M&A Activity: Reading Between the Deal Lines
M&A deals are strategic signals. When a competitor acquires a company, look beyond the press release. The target’s technology, team, and customer base reveal whether they’re filling a tech gap, entering a new market, or consolidating share. Deal size matters: a small acquisition (<$10M) often buys talent or a feature; a large one (>$100M) signals a major pivot or market adjacency play.
Practical steps to decode M&A activity:
- Track acquisition frequency – A sudden spike may indicate a land-grab strategy or defensive consolidation. Use tools like Crunchbase or PitchBook to log deals over time.
- Estimate valuation multiples – Compare deal value to target revenue (e.g., 5x–10x ARR for SaaS). If multiples rise across your sector, it signals frothy competition and higher exit expectations.
- Monitor integration speed – Check if the acquirer quickly rebrands, merges products, or retains the target’s leadership. Fast integration suggests a clear strategy; slow integration may indicate culture clash or poor due diligence.
- Benchmark revenue contribution – In earnings calls or investor updates, look for mentions of acquired revenue. If a competitor’s acquisition contributes >20% of growth, it’s a benchmark for your own M&A ROI.
Pro tip: Set up Google Alerts for your top 5 competitors + “acquires” to get real-time notifications. Then log each deal in a simple spreadsheet with columns for date, target, deal size, rationale, and integration status. Review quarterly to spot patterns and adjust your competitive strategy accordingly.
Building a Financial Intelligence Dashboard
To build a financial intelligence dashboard, start by monitoring four core metrics: revenue growth rate (quarter-over-quarter and year-over-year), EBITDA margins (to gauge operational efficiency), analyst consensus (mean target price and ratings), and stock price momentum (50-day vs. 200-day moving average crossovers). Use tools like Yahoo Finance API or Quandl to pull this data automatically.
Set up real-time alerts for earnings calls (via SEC EDGAR RSS feeds), analyst report releases (follow key analysts on platforms like TipRanks), and SEC filings (8-K, 10-Q, 10-K) using services like SEC Alerts or Dataroma. Configure Slack or email notifications to capture these signals within minutes of publication.
For a holistic view, correlate financial signals with non-financial data. For example, when a competitor files an 8-K announcing a new CFO, check if they also posted a spike in job listings for sales roles (using LinkedIn or Indeed scraping) and increased their Google Ads spend (via SEMrush). Create a correlation matrix in your dashboard—e.g., plot revenue growth against marketing spend changes. A sudden EBITDA margin drop alongside a product launch might indicate heavy R&D investment, not operational trouble.
Pro tip: Use a simple red-yellow-green traffic light system for each metric. Green = above industry average, yellow = in line, red = below. This gives you an instant snapshot of competitor financial health.
Actionable Takeaways: From Signals to Strategy
-
Benchmark Your Financial Health: Use competitors’ funding rounds and profitability metrics as benchmarks. Compare your burn rate, gross margins, and revenue growth to theirs. If a rival raised a large Series B, ask: Are we underinvesting in R&D or sales? Adjust your budget accordingly.
-
Anticipate Moves: A cash-rich competitor may soon cut prices, acquire a key supplier, or expand into your niche. Monitor their cash runway and recent M&A patterns. For example, if they just hired a VP of M&A, prepare a defensive strategy—lock in supplier contracts or diversify your supply chain.
-
Integrate into Regular Reviews: Add a “Financial Signals” slide to your monthly competitive review. Track: (a) funding announcements, (b) changes in valuation, (c) debt or credit line usage. Use a simple RAG (Red-Amber-Green) rating to flag urgency. For each signal, assign an owner to propose a tactical response (e.g., “Rival raised $50M → Our response: Accelerate feature X launch by 2 months”).
Quick Checklist:
- [ ] Set up Google Alerts for competitor funding news.
- [ ] Maintain a live spreadsheet of competitor cash positions.
- [ ] Quarterly, compare your unit economics vs. top 3 rivals.
- [ ] Before your next board meeting, prepare a “What If” scenario for a competitor acquisition.
Turn Signals into Action with RivalSense
Tracking all these financial signals manually is time-consuming. RivalSense automates the process, monitoring competitor product launches, pricing updates, partnerships, management changes, and—critically—the financial and M&A signals covered in this cheat sheet. We scan company websites, social media, news, and registries to deliver a concise weekly report straight to your inbox.
Try RivalSense for free to assist with the challenges described above. Get your first competitor report today and never miss a critical signal again.
📚 Read more
👉 🚨 Competitor Watch: Ola, Uber & Rapido Face App Store Removal – What This Means for Your Business
👉 Key Account Tracking Data Export: A Practical Guide for B2B Leaders
👉 5 Key Competitor Tracking API Mistakes in Custom Software Development
👉 How RivalSense Helped Meta Uncover a Competitor's AI Efficiency Breakthrough