
Data-Driven Insights: Competitor Trade Show Strategies in Semiconductor Support
In 2026, global semiconductor equipment sales are projected to hit $139 billion, making trade shows like SEMICON West and ASMC critical battlegrounds for visibility and intelligence. Unlike digital channels, the exhibition floor offers a rare window into competitor product roadmaps, pricing shifts, and partnership strategies—data that is seldom shared online. To turn these fleeting signals into actionable insights, adopt a systematic approach: before the show, define your intelligence goals (e.g., identify new product launches or pricing changes). During the event, use a structured checklist—capture booth messaging, demo scripts, and audience questions. Afterward, debrief within 48 hours while details are fresh. For example, one semiconductor support firm used SEMICON West booth conversations to detect a rival’s shift toward modular tooling, adjusting their own roadmap to counter. This article outlines a step-by-step method to collect, analyze, and act on competitor trade show signals specific to the semiconductor support ecosystem, ensuring you leave with more than just brochures.
Mapping the Semiconductor Support Event Landscape (2026–2027)
To build a competitor-focused event strategy, start by mapping the semiconductor support landscape. Key 2026–2027 events include SEMICON West (Oct 2026, San Francisco), ASMC (May 2026), SEMICON Europa (co-located with electronica), and region-specific summits like the Florida Semiconductor Summit. However, not every event is equal for your segment. Support specialization—test equipment, wafer handling, materials, fab infrastructure—determines intelligence density. For instance, test equipment competitors cluster at SEMICON West and ASMC, while materials suppliers dominate SEMICON Europa.
Practical steps to prioritize:
- List your top 5 competitors and their known event participation.
- Scrape event websites for exhibitor lists, speaker rosters, and sponsorship tiers. Look for recurring patterns—e.g., a competitor keynoting at multiple events signals strategic focus.
- Filter by segment overlap: If your competitors focus on wafer handling, prioritize events like SEMICON West over the Florida Summit (which emphasizes workforce development).
- Create a heatmap ranking events by competitor density (exhibits + speaking slots). Aim for events where 3+ top competitors are present—high density yields richer intelligence.
Pro tip: Use tools like RivalSense to automate tracking of competitor event announcements and exhibit changes, saving hours of manual calendar-checking.
Pre-Show Reconnaissance: Building a Competitor Watchlist
Before the trade show doors open, smart competitive intelligence begins with pre-show reconnaissance. Start by analyzing past exhibitor floor plans, booth footprints, and speaking slot allocations. A 20% increase in booth size or a keynote slot signals heightened investment.
Set clear intelligence goals aligned to your business priorities:
- Track new product launches (look for teaser campaigns or embargoed press releases)
- Monitor pricing moves (pre-show discount offers often surface in email drips)
- Scan for partnership announcements (joint press releases or co-branded collateral)
- Identify key hires visible in booth staffing (LinkedIn updates from competitor employees)
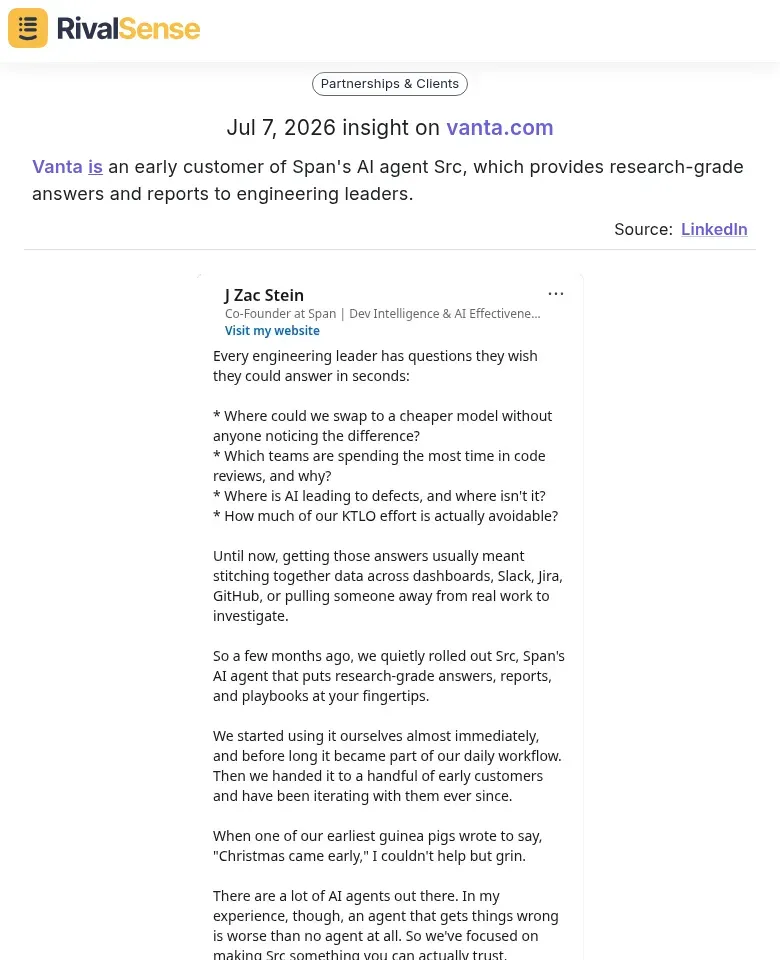
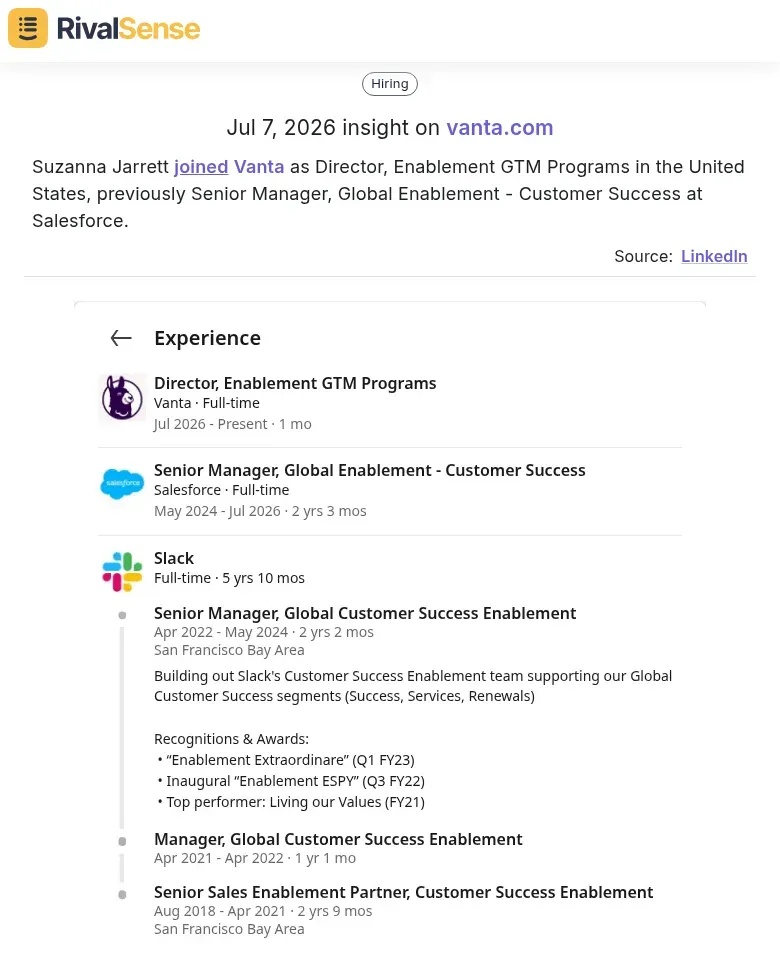
RivalSense automates detection of such signals. For instance, it recently highlighted that Vanta became an early customer of Span's AI agent Src, a partnership revealing product integration moves. Similarly, the hiring of Suzanna Jarrett from Salesforce as Director of Enablement GTM Programs at Vanta signals a focus on scaling go-to-market. Tracking these partnership and talent moves—regardless of industry—enables you to anticipate competitive plays before the show floor.
Equip your team with a structured data collection template to ensure consistency. Include fields for:
- Booth design (layout, tech integrations)
- Messaging (taglines, value props)
- Demos (features highlighted, speed/quality)
- Giveaways (relevance to buyer personas)
- Attendee engagement (demo wait time, social media buzz)
Pro tip: Assign one team member per competitor. Use a shared spreadsheet or a tool like RivalSense to log observations in real time. This pre-show legwork transforms vague curiosity into actionable competitive intelligence from Day 1.
On-the-Ground Tactics: Capturing Real-Time Competitive Signals
When your rivals exhibit at trade shows like SEMICON West, real-time intelligence is yours for the taking. Use this three-pronged approach:
1. Booth Observation Checklist
- Traffic patterns: Note peak times and dwell duration. Are they always crowded or attracting specific roles?
- Demo depth: Do they show live data from fabs or just slides? Deep demos hint at mature products.
- Lead capture: QR codes, badge scanners, or paper forms? Digital suggests a CRM-driven follow-up process.
- Tech stack indicators: Look for sensors (e.g., KLA, Onto Innovation) or software partners (e.g., PDF Solutions, Synopsys) displayed. A shift in partners signals strategic pivots.
2. Social & App Monitoring
- Set up alerts for competitor session titles and speaker names via event app schedules. Surprise keynotes often preview new offerings.
- Track influencer posts and press releases mentioning your competitors. A sudden flurry around yield improvement or AI-driven inspection could mean a product launch.
3. Attendee Networking
- Strike casual conversations at coffee stations or after-parties. Ask non-leading questions like “What’s the biggest headache with [competitor tool]?” Collect anonymous gripes about uptime, support, or integration challenges.
- Compile these into a competitive pain-point matrix to feed your product roadmap.
Combine booth observations, digital signals, and human intel to build a real-time picture—then adjust your own booth strategy on the fly.
Post-Show Analysis: From Raw Data to Strategic Action
Post-show analysis transforms raw observations into strategic action. Start by cross-referencing booth observations (e.g., new product demos, pricing sheets, press releases) to validate signals—a competitor's new pricing booklet may confirm a low-cost push. Then, quantify everything: measure booth size (compare floor plans year-over-year), count demo stations, estimate lead volume (staff-to-visitor ratio), and track share of voice via event hashtags (e.g., #SEMICON2026). Use a simple scoring matrix: weight each metric (e.g., booth size 20%, lead volume 30%) to produce a competitive intensity score.
Translate findings into actions. If a competitor's booth shrunk but demo stations increased, they may be focusing on quality over quantity—adjust your lead qualification accordingly. If they launched a product you're developing, consider accelerating your release or repositioning against their weakness. Create a priority matrix: high-impact/high-urgency items (e.g., price changes) go to product marketing; lower-urgency items (e.g., messaging shifts) feed your content calendar. Finally, assign owners and deadlines—raw data only becomes strategic when it drives decisions.
Building a Reusable Competitive Trade Show Intelligence Framework
To build a reusable framework for tracking competitor trade show activity, start by standardizing templates and dashboards. Use a tool like RivalSense to create a centralized event tracker where you log booth themes, product demos, messaging shifts, and audience engagement across multiple shows and years. This turns ad hoc observations into structured, searchable data.
Next, integrate trade show intelligence with broader competitive signals. Link your event dashboard to feeds monitoring competitor website changes (new case studies, leadership updates), hiring spikes (e.g., sales or R&D roles), and funding announcements. A 360-degree view reveals whether a trade show push aligns with a larger strategic pivot—for example, a startup unveiling a new chip at SEMICON while simultaneously posting job openings for application engineers signals a go-to-market ramp.
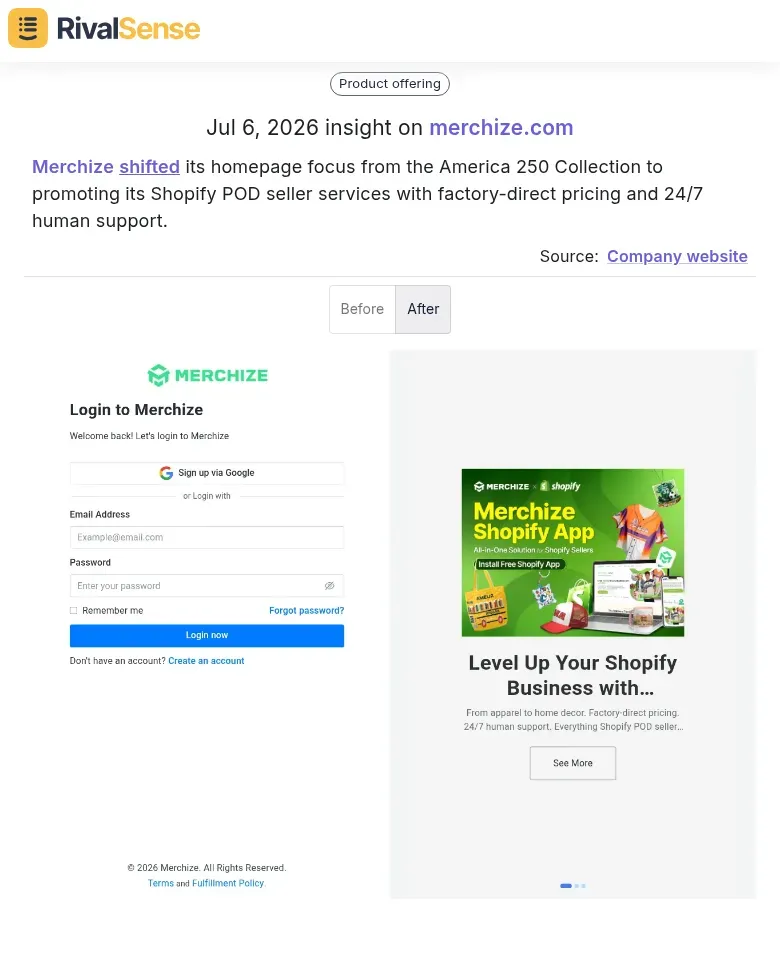
RivalSense can automatically flag these shifts. Consider how it detected that Merchize shifted its homepage focus from a collection to promoting Shopify POD services with factory-direct pricing and 24/7 support. While not semiconductor-specific, this type of insight—tracking website messaging changes—can be applied to monitor competitors' positioning adjustments after trade shows, ensuring you catch every pivot.
Finally, institutionalize a post-event debrief cadence: at 30 days, assess immediate pipeline impact (inbound leads, meeting quality); at 60 days, evaluate positioning changes (new collateral, pricing shifts); at 90 days, measure product decisions (features added or dropped). Use this timeline to adjust your own roadmap. For a quick-start checklist: (1) define key metrics per event, (2) assign a team member to update RivalSense within 48 hours, (3) schedule a 30-minute debrief meeting after each show. Over time, this framework turns trade show observations into actionable competitive intelligence.
Ready to turn scattered trade show signals into a systematic competitive advantage? RivalSense automates the tracking of competitor moves—from event participation and website changes to partnerships and hires—delivering a weekly report that keeps you ahead. Try RivalSense for free today and get your first competitor report now.
📚 Read more
👉 How TikTok's Travel Move Sparked Our Counter-Strategy
👉 Quick Instagram Hacks to Track Competitor Key Goals
👉 Track Financial Leaders: Actionable Strategies for Growth
👉 3 Quick Hacks to Track Competitors & Key Accounts at Events
👉 Competitor Partnership Advantages via Event Participation: A Process Optimization Guide