
Salesforce Key Account Tracking Cheat Sheet for Semiconductor Firms
In the fast-moving semiconductor industry, staying ahead of competitors requires real-time intelligence integrated into your CRM. This cheat sheet provides a practical framework for tracking key accounts in Salesforce—covering personnel moves, financial benchmarks, and automated alerts—to sharpen your sales strategy and account planning.
Tracking Key Hires and Organizational Changes
Monitoring executive movements (e.g., account directors, R&D leads) can reveal strategic shifts long before they appear in press releases. A new VP of Sales at a rival often precedes territory realignments, while a senior hire from an unexpected industry hints at market expansion. Tools like LinkedIn Sales Navigator or RivalSense automate this monitoring, delivering weekly alerts directly to your team.
For example, RivalSense recently surfaced two strategic hires at Broadcom:
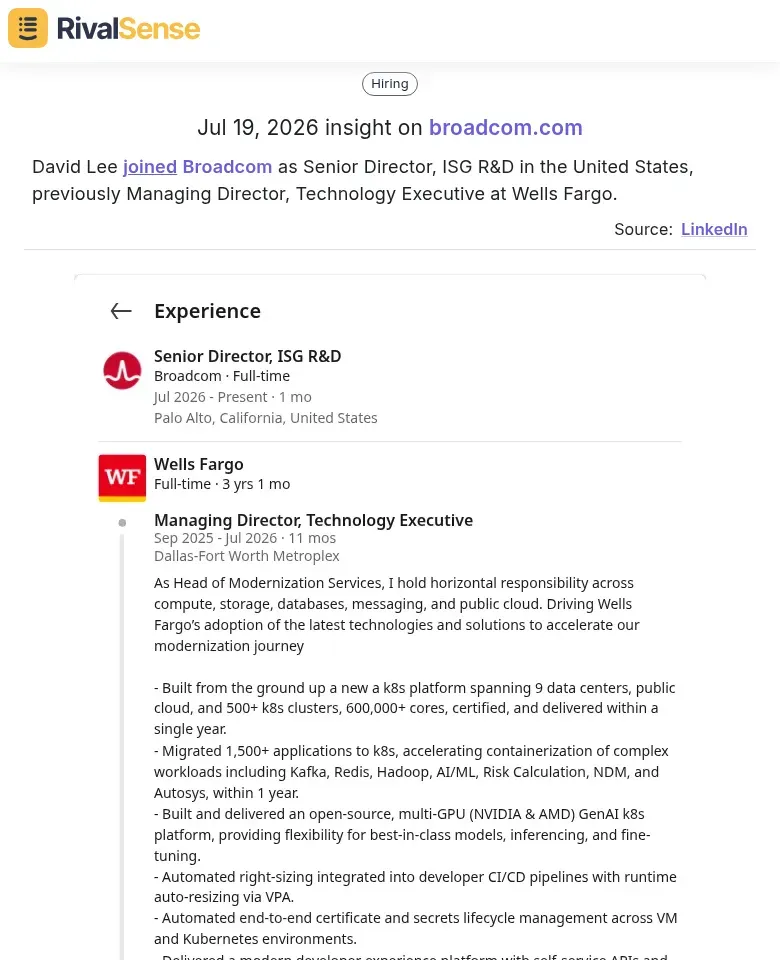
David Lee's move from Wells Fargo to lead R&D at Broadcom signals a likely push into financial services solutions. This type of insight is invaluable: when a competitor recruits a relationship manager from banking, they’re probably gearing up to serve that vertical.
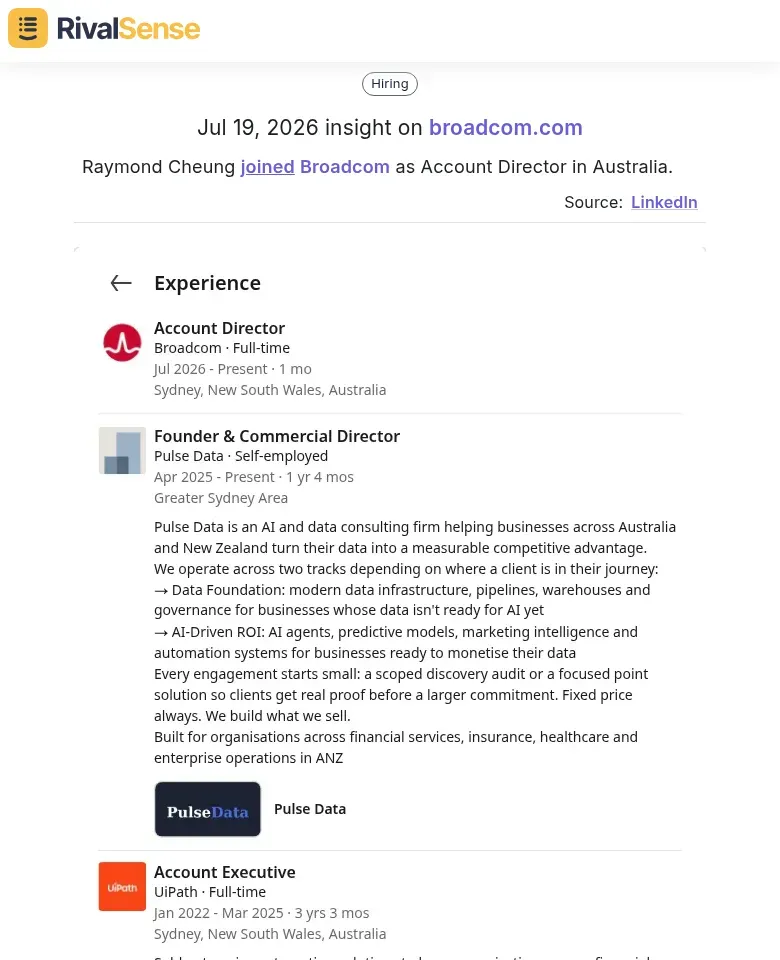
Raymond Cheung's appointment as Account Director in Australia suggests Broadcom is strengthening its regional presence—a cue for local sales teams to double down on engagement or pre-empt contract renewals.
Practical Steps:
- Define Signals: List roles to track (CTO, Head of Product, Key Account Managers).
- Automate Alerts: Use a CI tool like RivalSense to receive weekly summaries of title changes, new hires, and departures at target accounts.
- Map Impact: When a competitor hires from an adjacent industry, flag the possibility of a new market entry. When they hire a regional director, anticipate increased local competition.
- Update Salesforce: Modify account contact hierarchies within 24 hours of an alert: reassign relationships, note lost contacts, and add new stakeholders.
Tip: Create a picklist field in Salesforce called “Strategic Signal” with values like “New Hire from Adjacent Industry” to automatically trigger account plan reviews. Check organizational changes weekly.
Analyzing Financial Performance Metrics
Financial metrics offer a quantitative lens on key accounts—revealing their capacity to invest in new tools and signaling potential churn. By tracking market cap, revenue growth, and profit margins, you can tailor engagement strategies and prioritize high-value opportunities.
Consider this real insight from RivalSense on Broadcom:
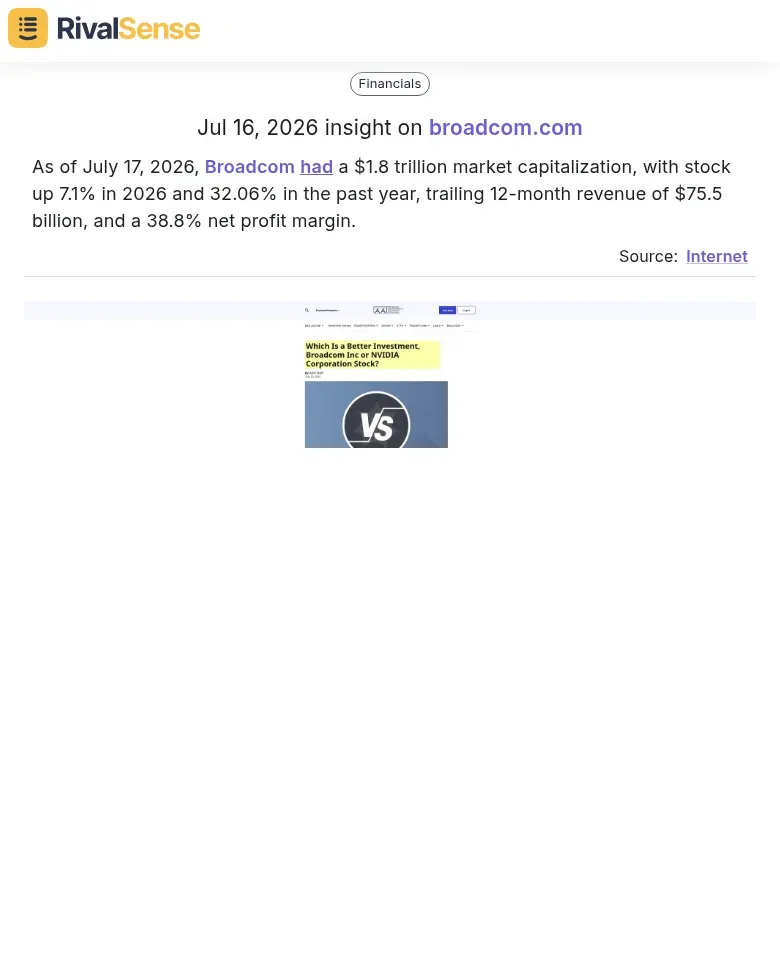
A $1.8 trillion market cap, rising stock, and a 38.8% net profit margin indicate a financially robust account with ample budget for premium solutions. Tracking such data points weekly helps you time upsell conversations and avoid accounts under margin pressure.
1. Market Cap & Stock Price Trends
- What to watch: Sustained stock price decline (>10% quarterly) signals weakening competitive momentum. A rising market cap relative to peers suggests growth capacity.
- Action: Set price alerts for your top 10 accounts using your financial data source of choice.
2. Revenue Growth & Net Profit Margins
- Revenue growth: Look for >15% YoY growth—indicates likely expansion in IT/CRM spending. Stagnation may signal budget freezes.
- Net profit margins: High margins (>20%) = room for investment in new tools. Low margins (<5%) = cost-sensitive accounts.
- Action: Create a simple spreadsheet with the last four quarters of revenue and margin data. Flag accounts crossing thresholds.
3. Correlate to Account Risk/Opportunity
- High-margin, high-growth accounts: Upsell premium features or multi-year contracts.
- Low-margin, declining accounts: Offer cost-optimization packages or flexible payment terms.
- Checklist: Monthly review of financial signals vs. account engagement scores. If both drop, escalate to executive sponsor.
Pro tip: Automate this with a Zapier workflow that pulls financial data into your CRM and flags accounts requiring attention.
Setting Up Automated Alerts for Competitive Signals
To avoid manual monitoring drudgery, configure automated alerts that push critical intelligence directly into Salesforce or your team's workflow. The goal is to react faster than competitors to shifts in the semiconductor landscape.
1. Personnel Change Alerts
Instead of building custom LinkedIn connectors, leverage a service like RivalSense that delivers weekly reports on hires, role changes, and departures at your target accounts. These reports can be automatically parsed and logged in Salesforce as Tasks or Custom Objects.
2. Financial Threshold Alerts
Set up triggers in Salesforce based on financial metrics. For instance, if a competitor's stock surges >15% or revenue drops >10% quarter-over-quarter, auto-assign a prioritization task to the account executive. Connect to financial APIs (e.g., Yahoo Finance) to populate custom fields.
3. News & Event Feeds
Filter press releases and media mentions using keywords: “new fab,” “partnership,” “layoff.” Tools like RivalSense already aggregate these signals from company websites, social media, and registries. Configure alerts when strategic announcements are detected and route them to the relevant team via Chatter or Slack.
Quick Tips
- Start with 3–5 critical triggers to avoid alert fatigue.
- Test all flows in a sandbox before production.
- Schedule monthly audits of alert logic to keep pace with market dynamics.
Integrating Intelligence into Account Planning & Sales Strategy
A dynamic account plan requires layering competitive intelligence onto your Salesforce data. The following practices help you turn signals into actionable sales moves.
1. Map Competitive Hires to Account Relationships
Create a custom object in Salesforce that links a new hire to their previous company and role. When a key account hires a former competitor’s VP of Sales, the risk of churn rises—but it’s also an opportunity to strengthen ties before relationships shift. Use a weekly report from RivalSense to populate this object automatically.
2. Prioritize Accounts with a Combined Scorecard
Merge personnel moves and financial metrics into a single view. Example fields:
- Talent Score: Number of competitor hires (weighted by seniority)
- Financial Score: Composite of revenue growth, cash, and R&D spend
- Relationship Score: Meeting frequency and open opportunities
Build a roll-up summary on the Account object to visualize these scores. When the Talent Score spikes, automatically assign a dedicated account manager to deepen engagement.
3. Tailor Sales Pitches and Timing
- Pitch content: If a competitor hires an ASIC expert, emphasize your customizable IP offerings in your next outreach.
- Timing: Reach out 2–3 weeks after an account’s earnings call, when they’re reviewing budgets. Set CRM reminders based on earnings dates, and reference their latest guidance.
- Decision-maker shifts: Restructurings or spin-offs shift buying authority. Cross-reference press releases with LinkedIn to map the new hierarchy and target emerging influencers.
Hint: Refresh scorecards quarterly. Validate assumptions by assigning a “confidence score” based on data recency.
Building a Custom Salesforce Dashboard for Key Accounts
Wrap your intelligence efforts into a lean, at-a-glance dashboard. A well-designed Salesforce dashboard gives your team instant insight without switching tools.
Widget 1: Competitive Hiring Alerts
Surface recent hires at each target account using data from a CI tool like RivalSense. Filter by role (VP, Director) and date (last 30/90 days). Add a red badge for hires from your own company.
Widget 2: Real-Time Financial Snapshot
Connect to a financial data API to display current market cap, stock price, and 52-week high/low. Use conditional formatting: green for stock up >5%, red for down.
Widget 3: Revenue & Margin Trend Lines
Plot historical quarterly revenue and profit margin as a dual-axis line chart. Highlight inflection points (e.g., margin drop >10% quarter-over-quarter) to trigger immediate review.
Pro tip: Filter all widgets by a “Key Account” custom field and refresh daily via a scheduled Apex batch. Pilot with 5 accounts before rolling out to the entire team.
Staying on top of key accounts in the semiconductor space demands a steady stream of accurate intelligence. RivalSense automates the heavy lifting—tracking hires, financials, partnerships, and media mentions across company websites, social media, and registries—and delivers it all in a weekly report. Try RivalSense for free and get your first competitor report today, giving your team the immediate insights they need to act before the competition does.
📚 Read more
👉 Productivity Techniques for Competitor Financial & M&A Insights
👉 Data-Driven Insights on Competitor Partnerships in Warehousing
👉 Japan-NVIDIA AI Deal: How a Startup Turned a Threat Into a $10B Opportunity
👉 Quick Hacks: Spot Competitor Innovation in AI Coding Tools