
Predictive Analysis: What Gives Your Competitors an Edge
Predictive analysis in competitive intelligence uses historical data, machine learning, and statistical algorithms to forecast competitors' future moves—pricing shifts, product launches, or market expansions. Unlike traditional tracking (which merely logs past actions like press releases or website updates), predictive analysis answers “what’s next?” rather than “what happened?” For B2B leaders, this forward-looking edge is critical: reactive strategies leave you playing catch-up, while proactive ones let you seize opportunities or mitigate threats before they materialize.
How it differs: Traditional competitor tracking monitors observable signals (e.g., hiring posts, patent filings, social media activity). Predictive analysis synthesizes these signals with external data (market trends, economic indicators) to model likely outcomes. Example: A SaaS competitor posts a job listing for a “data engineer” and increases ad spend on AI-related keywords. Traditional tracking reports the job post; predictive analysis estimates a new AI feature launch within 6 months.
Practical checklist for starting:
- 📋 Collect at least 12 months of competitor activity data (pricing, features, hiring).
- 🎯 Identify 3–5 leading indicators per competitor (e.g., job postings → product changes).
- 📈 Use a simple trendline tool (e.g., Excel, Google Sheets) to spot patterns.
- 🔍 Cross-reference with industry reports to validate assumptions.
Tip: Begin with one competitor and one predicted action (e.g., pricing change). Test your forecast accuracy over 90 days, then expand. The goal isn’t perfect prediction—it’s reducing uncertainty faster than your rivals.
📊 Key Data Sources for Predictive Insights
To predict your competitors' next moves, you need the right data sources. Start with public signals: monitor product launches via press releases and changelogs, track hiring patterns (e.g., surge in sales roles may signal expansion), and watch funding news through Crunchbase or PitchBook. Tip: Set up Google Alerts for competitor names + keywords like 'partnership' or 'beta'.
Media mentions often serve as early indicators of brand momentum and market standing. For instance, when Lyft was recognized on TIME's America's Best Companies 2026 list, it signaled strong customer and stakeholder perception.
Such award insights can be valuable because they frequently precede partnership announcements, talent attraction wins, or funding rounds—allowing you to anticipate shifts in competitive positioning.
Next, tap customer feedback and market sentiment. Analyze review sites (G2, Capterra), social media mentions, and support forums for unmet needs your competitors might address. Checklist: Track sentiment trends quarterly to spot shifts in priorities.
Finally, integrate internal sales data and win/loss analysis. Categorize why deals were won or lost—common objections reveal competitor strengths you can counter. Step: Create a win/loss template with fields for competitor mentioned, product features compared, and pricing differences. Review monthly to identify patterns.
Combine these sources into a dashboard to spot early signals—like a competitor’s R&D hire followed by a patent filing—before they launch.
🔎 Analyzing Competitor Moves and Patterns
🚦 Leading Indicators
To stay ahead, you need to identify leading indicators—signals that precede major strategy shifts. Watch for sudden changes in hiring (e.g., new roles in AI or sales), website messaging pivots, or unusual social media activity. Create a shared dashboard to track these signals weekly.
🗺️ Mapping Competitor Roadmaps
Map competitor roadmaps by mining patent filings and R&D investments. Use Google Patents or USPTO to search for patents by competitor name—look for clusters in specific tech areas. Cross-reference with their job postings: if a company hires 10 engineers focused on “automated pricing,” a pricing tool launch is likely. Track R&D spend as a % of revenue in quarterly reports; a sudden spike signals a new product push.
🔄 Detecting Recurring Tactics
Detect recurring tactics in pricing, marketing, and partnerships. Build a simple spreadsheet: log each pricing change (date, type—discount, bundling, freemium), marketing campaigns (channel, angle, timing), and partnerships (type, exclusivity). After 3–6 months, patterns emerge—e.g., quarterly discount pushes or annual conference-led launches. Use these patterns to anticipate their next move.
Marketing and promotional cadence often reveals how a competitor builds engagement. For example, Stake recently updated its promotions list and added a new sponsorship section for Iker Casillas as Spanish Football Ambassador.
Tracking such updates helps you predict upcoming campaign themes and budget allocation; you can then align your own promotional calendar to counter or differentiate effectively.
If a competitor always drops prices in Q4, prepare your value messaging ahead of time. Collaborate with sales to validate patterns in real deals. This systematic approach turns scattered data into a predictive edge.
🧠 Identifying Competitive Advantages Through Predictive Models
To identify what gives competitors an edge, start by building predictive models that forecast their market share and revenue trends. Use historical data—public financials, hiring patterns, and product launches—to train regression or time-series models. Tools like Prophet or ARIMA can extrapolate growth trajectories. For example, if a competitor's R&D spend correlates with subsequent market share gains, your model can flag upcoming threats.
Next, assess competitor strengths in emerging technologies or customer segments. Analyze job postings for roles in AI, quantum computing, or sustainability. A surge in hires for a specific domain signals strategic focus. Scrape patent filings to map innovation clusters. If a competitor files patents in a new vertical, they may be pivoting—prepare counterstrategies.
Real-world signals bring these models to life. Consider Kiho’s launch of Kiho Labs, a testing environment for workflows and features based on customer requests, accessible via an open demo with fictional data in multiple languages.
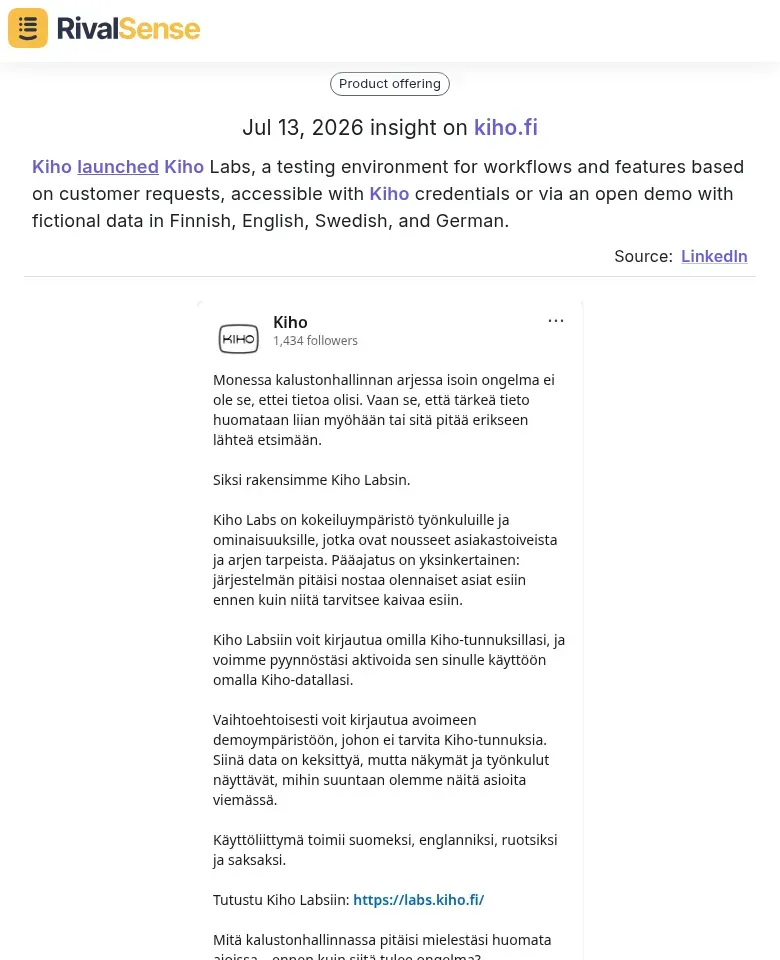
Product launches like this reveal a shift toward user-driven innovation and rapid experimentation, making it an early input for models predicting feature release velocity or geographic expansion.
Scenario planning helps evaluate potential competitor responses. Create 3–5 scenarios (e.g., aggressive pricing, M&A spree, platform shift) and model their impact on your position. Use Monte Carlo simulations to quantify uncertainty. Actionable tip: hold quarterly war games with cross-functional teams to pressure-test scenarios. Assign 'red teams' to roleplay competitor moves—this uncovers blind spots in your strategy.
Quick checklist: ✅ Identify key variables (e.g., pricing, innovation spend). ✅ Build a baseline model. ✅ Validate with recent market moves. ✅ Run 'what-if' scenarios. ✅ Update models monthly as data refreshes. Predictive analysis turns reactive monitoring into proactive strategy—giving you the edge your competitors thought they had.
⚡ Turning Predictions into Strategic Action
Predictions are useless without action. Here’s how to transform intelligence into strategic moves.
1. Prioritize threats by impact and urgency
Plot predicted competitor moves on a 2×2 matrix:
| Impact / Urgency | Now | Later |
|---|---|---|
| High | Immediate cross‑functional task force | Watch with trigger points |
| Low | Monitor monthly | Ignore |
High-impact, high-urgency threats demand immediate cross-functional task forces. Low-impact, low-urgency items go to a watch list. This prevents firefighting and focuses resources on what truly matters.
2. Align teams on proactive vs. reactive playbooks
Proactive moves (e.g., preemptively launching a feature) require R&D and marketing alignment. Reactive moves (e.g., price match) need Sales and Ops ready. Create a RACI chart for each scenario: who decides, who executes, who monitors.
3. Build a lightweight decision framework
Use this 3-step checklist for each predicted move:
- Assess: What’s the probability? (0-100%)
- Impact: Revenue at risk? (Low/Med/High)
- Action: If probability >60% and impact High → execute countermeasure. Else → monitor quarterly.
4. Align product positioning
Map competitor’s predicted angle (e.g., discounting, new feature) against your product strengths. If they undercut on price, double down on value differentiation. Update your sales battle cards proactively.
Hint: Run a 30-minute “war games” session monthly with key stakeholders to pressure-test predictions and adjust actions.
❌ Common Pitfalls and How to Avoid Them
Even the best predictive analysis can misfire. Here are three common traps and how to sidestep them.
1. Overreliance on Incomplete or Biased Data
Pitfall: Basing predictions solely on your own sales data or industry reports, ignoring external signals like social sentiment or competitor hiring trends.
Avoid It: Create a data diversity checklist: include at least three distinct sources (e.g., web traffic, job postings, customer reviews). Cross-validate findings—if two sources disagree, dig deeper before acting.
2. Confirmation Bias When Interpreting Signals
Pitfall: Seeing only the data that supports your existing beliefs (e.g., interpreting a competitor’s price drop as desperation rather than a strategic expansion).
Avoid It: Assign a “devil’s advocate” for every analysis. Before finalizing insights, ask: “What would disprove this conclusion?” Use structured frameworks like SWOT to force consideration of alternative explanations.
3. Failing to Update Models with Real-Time Changes
Pitfall: Using quarterly reports to inform monthly decisions, missing rapid shifts like a competitor’s new feature launch or funding round.
Avoid It: Set up automated alerts for key triggers (e.g., product announcements, leadership changes). Schedule monthly model refreshes and create a “watchlist” of leading indicators (e.g., job ads for certain roles) that signal early moves. Adjust weightings monthly based on recent signal strength.
Quick Checklist for Reliable Predictions:
- ✔ Diversify data sources (min 3).
- ✔ Challenge assumptions with a devil’s advocate.
- ✔ Refresh models & alerts at least monthly.
- ✔ Track leading indicators, not just lagging results.
🚀 Stay Ahead with Real-Time Competitor Insights
Predictive analysis becomes exponentially more powerful when you feed it with fresh, structured competitor data. Manually piecing together signals from websites, job boards, and registries is time‑consuming and hole‑prone. Instead, executives who automate competitor tracking can detect early signals—like product launches, pricing moves, or media recognition—weeks before they become common knowledge.
A tool like RivalSense continuously monitors hundreds of competitor signals across websites, social media, and registries, delivering a concise weekly email with only the moves that matter. Whether it’s a new lab environment launch, a promotional push, or an industry award, such insights feed directly into the predictive analysis workflows outlined above, helping you act before the market shifts.
👉 Try RivalSense for free to get your first competitor report and start turning real‑time tracking into predictive advantage—today.
📚 Read more
👉 Wialon's ChatGPT Move Sparked Our Competitive Response
👉 Predict Competitor Moves Using Website Change Alerts
👉 A Beginner’s Guide to Tracking Key Account Goals in Tech
👉 3 Real-World Examples of Tracking Key Account Spend with Competitor Insights
👉 Decoding Competitor Signals: What Veriff’s 52.7% Accuracy Breakthrough Teaches Us