
Key Account KPIs in AI: Optimize NVIDIA-Style Growth
Introduction: Why AI-Native KPIs Matter for Key Account Growth
Traditional key account KPIs—revenue, retention, NPS—were designed for linear, product-centric markets. In AI-driven industries, where speed, ecosystem depth, and data moats define competitive advantage, these metrics miss the real drivers of growth. NVIDIA’s meteoric rise from GPU maker to AI infrastructure giant illustrates why. Its key accounts aren’t just buyers; they’re technical partners co-developing CUDA ecosystems, integrating hardware into their stacks, and building data flywheels that lock in dependency. The result? Account values that compound, not just renew.
To replicate this, B2B leaders must adopt AI-native KPIs that measure technical integration depth, co-innovation velocity, and ecosystem stickiness. This post outlines five such metrics, inspired by NVIDIA’s playbook, that you can adapt for your own key accounts.
Quick tip: Start by auditing your top 10 accounts. For each, ask: How deeply is our technology embedded in their product or workflow? If the answer is “surface-level,” you’re leaving growth on the table.
KPI #1: Ecosystem Integration Depth (Beyond Revenue Share)
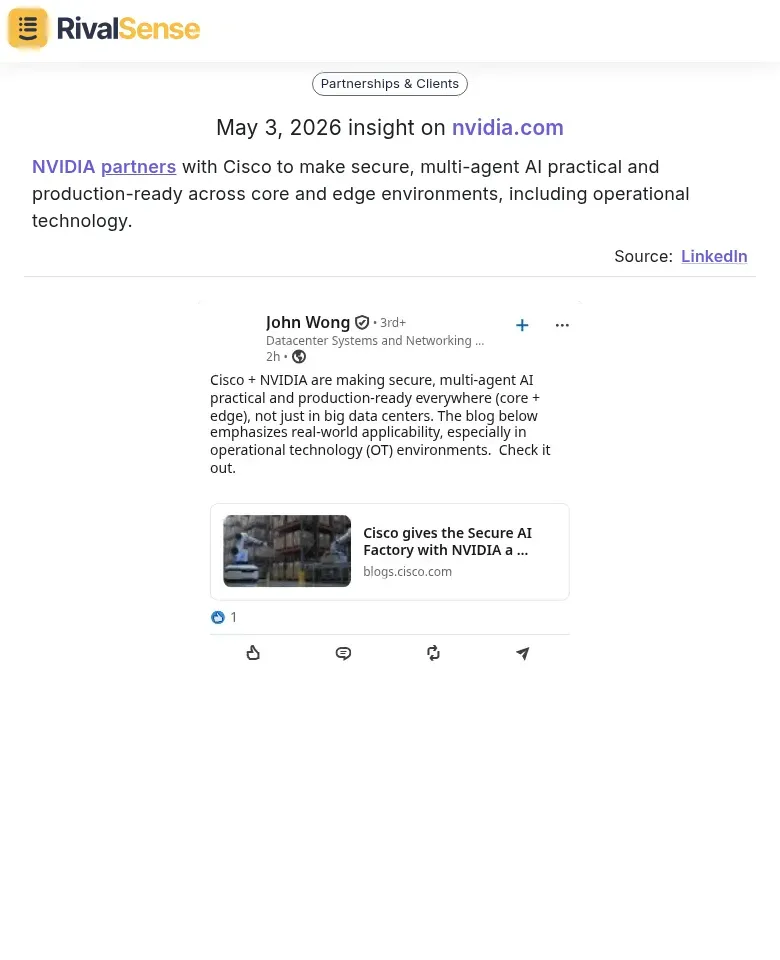
Revenue share is a lagging indicator. Integration depth is a leading one. Measure how deeply your product is embedded in a partner’s tech stack—track joint product launches, shared APIs, and co-developed solutions. NVIDIA’s partnerships with Cisco (secure multi-agent AI) and Google Cloud (Omniverse) prove that deep integration predicts long-term revenue more reliably than deal size.
Real insight from RivalSense: Tracking competitor partnerships like this one can reveal emerging ecosystem shifts and integration standards that may affect your own account strategy. For example, RivalSense captured this update:
Practical Steps:
- Track integrated systems: Count the number of distinct systems your product connects with per account (e.g., CRM, ERP, data lakes).
- Log co-engineering hours: Record time spent on joint development, API alignment, and custom integrations.
- Monitor joint GTM initiatives: Note co-marketing campaigns, co-sold deals, and shared customer events.
Checklist for Each Key Account:
- [ ] Number of active API integrations ≥ 3
- [ ] Co-engineering hours per quarter ≥ 100
- [ ] Joint GTM launches in last 6 months ≥ 1
- [ ] Shared product roadmap items ≥ 2
Tip: Use a weighted score (e.g., 40% integrations, 30% co-engineering, 30% GTM) to create a single “Integration Depth Score.” Review quarterly with account teams. Accounts scoring above 80% consistently deliver 2–3x higher lifetime value.
KPI #2: Co-Innovation Velocity (Time from Pilot to Production)
Speed from proof-of-concept to production is a leading indicator of account health and competitive moat. The faster you move, the deeper the customer’s dependency on your platform. NVIDIA exemplifies this: its rapid co-innovation cycles with Adobe and WPP turned experimental AI pilots into scaled autonomous ad production, locking in long-term partnerships.
Real insight from RivalSense: Product launch and update insights—like this one about Omniverse—show how fast a competitor is moving from pilot to scale, which can inform your own innovation benchmarks:

Why it matters: A slow pilot-to-production pipeline signals integration friction, misaligned priorities, or weak technical fit—all vulnerabilities competitors can exploit. Conversely, high velocity means your solution is becoming embedded in the customer’s core operations.
How to measure:
- Average time-to-production for joint projects (target: <6 months for AI initiatives).
- Pilot-to-production conversion rate (aim for >60%).
Practical steps to accelerate:
- Dedicated cross-functional pods – Assign a small team of engineers, product managers, and customer success to each key account, reducing handoff delays.
- Shared success milestones – Define clear, time-bound checkpoints (e.g., data integration complete by week 2, model accuracy threshold by week 4).
- Executive sponsorship – Ensure both sides have a senior champion who can unblock resources quickly.
- Reusable playbooks – Document common integration patterns from past pilots to avoid reinventing the wheel.
Checklist for your next pilot:
- [ ] Joint roadmap with 30/60/90-day goals
- [ ] Weekly syncs with decision-makers
- [ ] Automated monitoring of deployment blockers
- [ ] Post-pilot retrospective within 1 week
Track this KPI monthly. If velocity drops, investigate root causes immediately—it’s often the first sign of a slipping relationship.
KPI #3: Data Asset Moat (Proprietary Data Generated per Account)
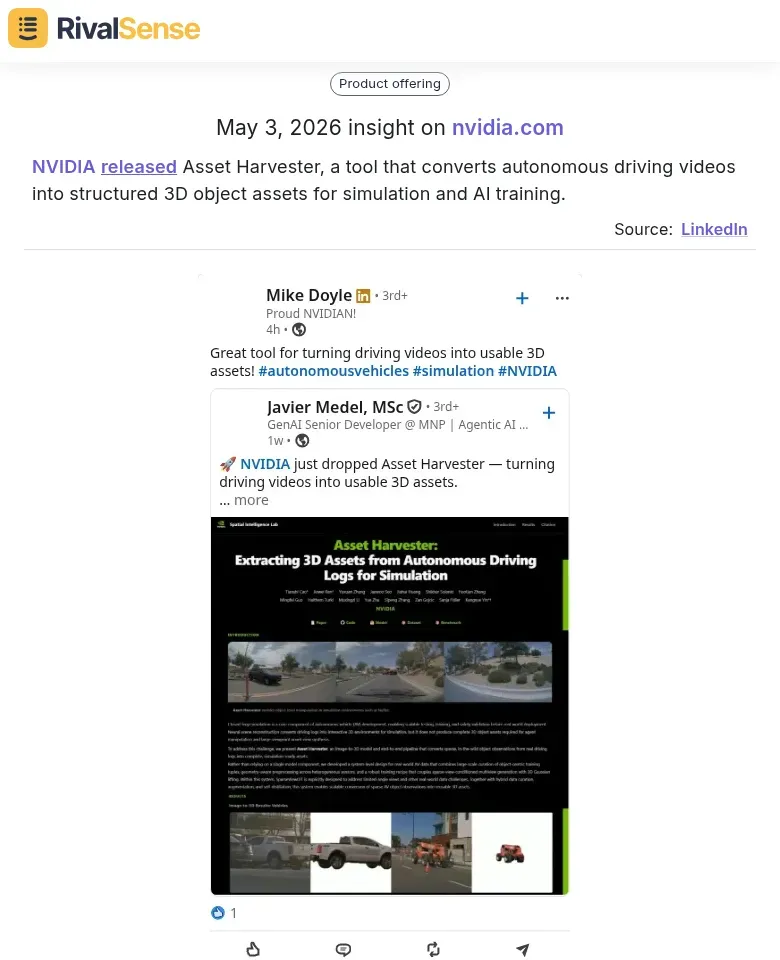
AI models thrive on proprietary data. When an account contributes unique training data, their switching costs skyrocket—your model improves with their data, making it harder for them to leave. NVIDIA’s Asset Harvester tool exemplifies this: it converts customer driving data into 3D assets, creating a data flywheel where each contribution deepens dependency.
Real insight from RivalSense: Tool and feature releases like this can signal new ways competitors are building data moats—valuable to anticipate when advising your own key accounts:
Track these metrics:
- Volume of proprietary data contributed (e.g., hours of driving footage, number of 3D assets generated).
- Model improvement attributable to account data (e.g., accuracy lift percentage linked to their dataset).
- Data-sharing agreement renewals (renewal rate signals sustained value).
Practical steps to build your moat:
- Identify high-value data sources in your customer’s workflow—logs, usage patterns, domain-specific inputs.
- Create a contribution pipeline (e.g., automated uploads, SDKs) that makes data sharing frictionless.
- Show value back to the account: share model performance gains, personalized insights, or exclusive features tied to their data.
- Set data-sharing milestones in contracts (e.g., quarterly data contributions) to formalize the relationship.
Checklist for implementation:
- [ ] Map customer data types that improve your model.
- [ ] Build a dashboard for customers to see their data’s impact.
- [ ] Offer tiered benefits based on data volume (e.g., priority support, early access).
- [ ] Monitor churn rate of high-data-contributors vs. low-contributors.
Pro tip: Start with a pilot account to measure the correlation between data contribution and retention before rolling out broadly.
KPI #4: Ecosystem Multiplier Effect (Indirect Influence on Adjacent Accounts)
A key account’s value isn’t limited to its direct revenue—it ripples through partners, suppliers, and industry standards to attract adjacent accounts. NVIDIA’s Omniverse collaborations with Google Cloud and Adobe/WPP exemplify this: each partnership creates network effects that draw in new customers seeking compatibility and innovation.
How to measure it:
- Referral rate: Track how many new accounts cite the key account as an introduction or reference.
- Co-marketing reach: Measure impressions, leads, or pipeline generated from joint webinars, case studies, or events.
- Influenced accounts: Count new logos that adopted your solution after the key account’s ecosystem activity (e.g., joining a partner program or adopting a standard).
Practical steps to amplify the effect:
- Map the ecosystem: Identify the key account’s top partners, suppliers, and customers. Prioritize those with high influence.
- Create joint enablement: Develop co-branded content, reference architectures, or integration guides that make it easy for adjacent accounts to adopt your solution.
- Incentivize referrals: Offer the key account perks (e.g., premium support, early access) for warm introductions to high-potential prospects.
- Track attribution: Use CRM tags and UTM parameters to link ecosystem activities to new account creation.
Pro tip: Don’t just count referrals—qualify them. A referral from a key account’s C-suite to a peer at a target account is worth 10x a generic mention. Focus on depth over volume.
KPI #5: Strategic Alignment Score (Roadmap Synchronization)
Long-term account value hinges on how well your product roadmap aligns with the account’s strategic AI initiatives. NVIDIA’s partnerships thrive because they synchronize roadmaps—for instance, Omniverse aligns with Google Cloud’s agentic AI push, creating mutual value. To measure this, calculate a Strategic Alignment Score quarterly.
How to score it:
- Shared R&D priorities (40%): Count overlapping projects in your product roadmap vs. the account’s published AI strategy. Example: If both prioritize edge AI inference, score high.
- Joint patent filings (30%): Track co-filed patents or IP contributions. One joint patent = 10 points; scale to 100.
- Co-authored industry standards (30%): Participation in standards bodies (e.g., MLCommons, IEEE) together. Each standard working group = 15 points.
Practical steps:
- Map your roadmap to the account’s public AI initiatives (e.g., blog posts, investor calls).
- Schedule quarterly alignment reviews with the account’s product team.
- Identify gaps—e.g., if they invest in federated learning but you don’t, propose a joint research sprint.
Checklist for Q2:
- [ ] List top 3 account AI initiatives.
- [ ] Identify 2 overlapping R&D areas.
- [ ] Initiate one joint patent discussion.
- [ ] Join one relevant standards body together.
A score above 70 indicates strong strategic lock-in; below 40 signals risk of displacement.
Turn Insights into Action with RivalSense
Staying ahead of competitors like NVIDIA requires real-time visibility into their product launches, partnerships, pricing changes, and more. RivalSense tracks these signals across company websites, social media, and public registries—delivering a concise weekly email report so you can adapt your key account strategy fast. Try RivalSense for free at https://rivalsense.co/ and get your first competitor report today.
📚 Read more
👉 Pricing Trends: Key Account Tracking Insights for Competitive Edge
👉 Competitor Analysis: How to Leverage Event Participation Insights (VMware Explore 2026 Case Study)
👉 Key Success Factors for Building a Best Practice Key Account Management Organization
👉 Key Account Management FAQs: Advanced Tactics for SEO & Content Marketing
👉 How Databricks' Startup Pivot Revealed a $2B Opportunity for Competitors