
5 Productivity Techniques for Faster Competitor Analyst Report Summaries
In today’s fast-moving markets, the volume of competitor data is exploding—news, product launches, pricing changes, social chatter, and more. Without a system, teams drown in information, leading to analysis paralysis: spending hours reading but never acting. Speed is the antidote. Faster summaries don’t mean sacrificing quality; they mean freeing up time for what matters—strategic decision-making. When you can distill a competitor’s quarterly update in 10 minutes instead of an hour, you can pivot pricing, adjust messaging, or spot a market gap before rivals do. This post covers five productivity techniques that will slash your report-writing time:
- The Pyramid Principle for structuring insights
- AI-assisted drafting with human review
- A daily “scan-and-capture” habit
- Template-based report frameworks
- A weekly 30-minute synthesis sprint
Each includes actionable steps you can implement today. Let’s turn data overload into competitive advantage.
Technique 1: The Pomodoro Method for Focused Research Sessions
Competitor analysis demands deep focus, but constant context switching—jumping between websites, reports, and dashboards—kills productivity. The Pomodoro Method structures research into 25-minute focused blocks, each dedicated to a single source or metric.
How to apply it:
- Set a clear goal per block. Example: Block 1: Analyze competitor A’s pricing page. Block 2: Extract feature updates from their changelog.
- Work for 25 minutes with no distractions—close Slack, email, and unrelated tabs.
- Take a 5-minute break to jot down key findings in a categorized template (e.g., Pricing, Features, Marketing).
- After 4 blocks, take a longer 15–30 minute break to synthesize insights.
Pro tips:
- Use a timer app (e.g., Forest, Focus Keeper) to enforce blocks.
- Keep a “parking lot” for interesting but off-topic items to review later.
- If a block ends mid-sentence, stop anyway—resume next block with fresh eyes.
Why it works: Short bursts prevent mental fatigue, while breaks force you to categorize findings immediately, reducing post-research cleanup. By avoiding context switching, you maintain deep focus on metrics like pricing changes, feature launches, or ad copy shifts—critical for faster, more accurate summaries.
Technique 2: Template-Driven Report Structures
Stop reinventing the wheel every time you write a competitor analysis. Pre-built templates enforce consistency, eliminate formatting decisions, and let you focus on insights.
What to standardize:
- SWOT Analysis – Strengths, Weaknesses, Opportunities, Threats (one row per competitor)
- Feature Comparison Matrix – Rows = features, columns = competitors, cells = ✓/✗/partial
- Market Positioning Map – Price vs. value quadrant with competitor dots
- Executive Summary – Top 3 takeaways + recommended action
Step-by-step:
- Build a master template in Google Docs/Notion with placeholders (e.g.,
[Competitor Name]). - Create a checklist of required sections: Overview → SWOT → Feature Comparison → Pricing → Market Position → Recommendations.
- Pre-fill recurring data – update competitor logos, URLs, and last-updated dates automatically.
- Use conditional logic (e.g., Notion databases) to hide sections not relevant to a specific analysis.
Pro tip: Keep a “template library” with variants: a 1-page quick-scan for executives, a 5-page deep-dive for product teams, and a slide deck for board meetings. Each template should take ≤5 minutes to populate.
Checklist for your template:
- [ ] Consistent heading hierarchy (H1, H2, H3)
- [ ] Color-coded status badges (e.g., red = threat, green = opportunity)
- [ ] Placeholder for data sources & dates
- [ ] Auto-calculated fields (e.g., total feature count per competitor)
By removing layout decisions, you reclaim 30–45 minutes per report – time you can spend on analysis that actually drives strategy.
Technique 3: The 80/20 Rule – Prioritizing High-Impact Insights
Not all competitor data is created equal. The Pareto Principle applies here: 80% of actionable insights come from just 20% of the data. The trick is identifying that high-impact 20% early.
Focus on three critical areas:
- Pricing changes: A price drop or hike signals strategic shifts.
- Product launches: New features or offerings directly affect your positioning.
- Messaging updates: Changes in value props or target audiences reveal market focus.
How to apply it:
- Create a priority checklist: Before analyzing, list what matters most—e.g., pricing updates, new competitors, feature releases. Stick to it.
- Use a noise filter: Ignore vanity metrics (e.g., social likes) and unsubstantiated rumors. Ask: "Will this change my strategy?" If not, skip it.
- Time-box your scan: Spend 20% of your research time on broad monitoring, then 80% deep-diving into the high-impact signals.
Pro tip: Set up automated alerts for your top three priority areas. This way, you only dive deep when something truly relevant surfaces—saving hours per report.
Real-World High-Impact Insights
To illustrate what high-impact insights look like, here are three examples spotted through competitor monitoring. Each type carries strategic value:
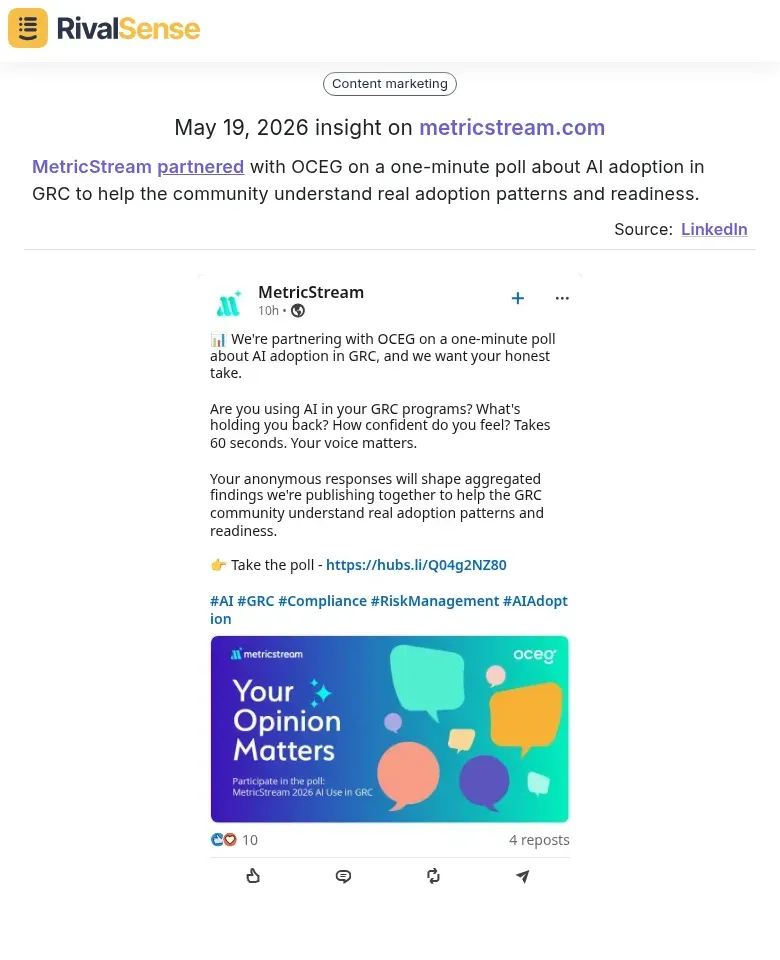
1. Partnership Insights – When a competitor partners with an industry body or research firm, it often signals a push for thought leadership or market validation. For instance, MetricStream partnered with OCEG on a one-minute poll about AI adoption in GRC to help the community understand real adoption patterns and readiness. This type of insight can help you anticipate shifts in industry standards or identify new co-marketing opportunities.
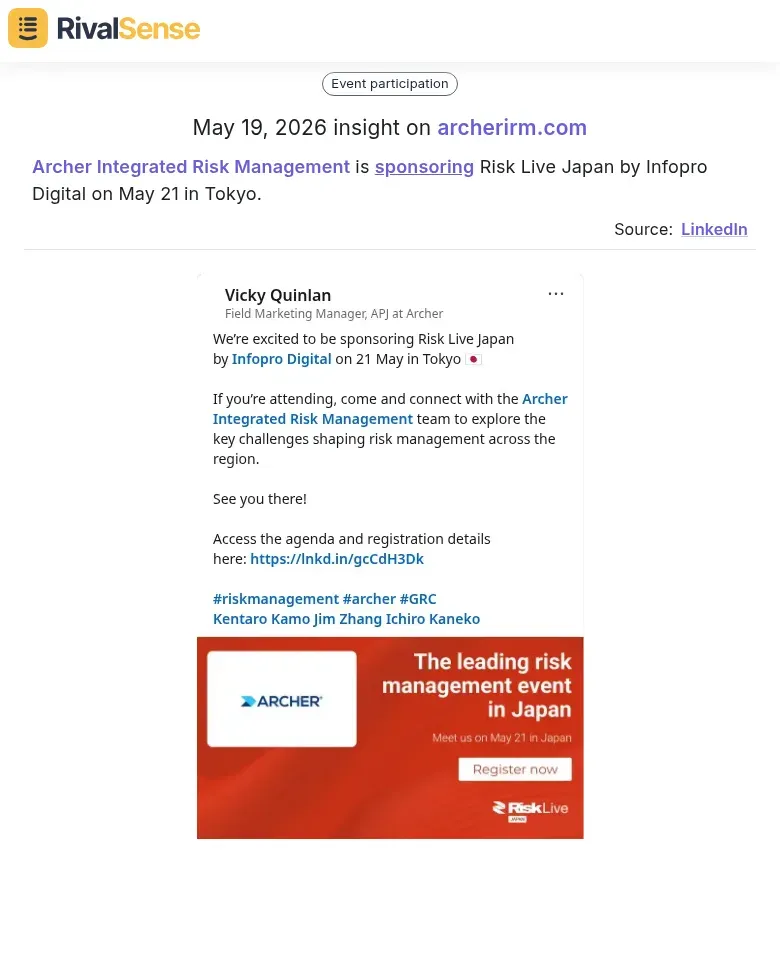
2. Event Sponsorship Insights – Sponsoring targeted events reveals where a competitor is focusing geographically or segment-wise. Archer Integrated Risk Management is sponsoring Risk Live Japan by Infopro Digital on May 21 in Tokyo. This tells you they are investing in the Japanese risk management market—a signal you can use to adjust your own regional strategy or preempt competitive moves.
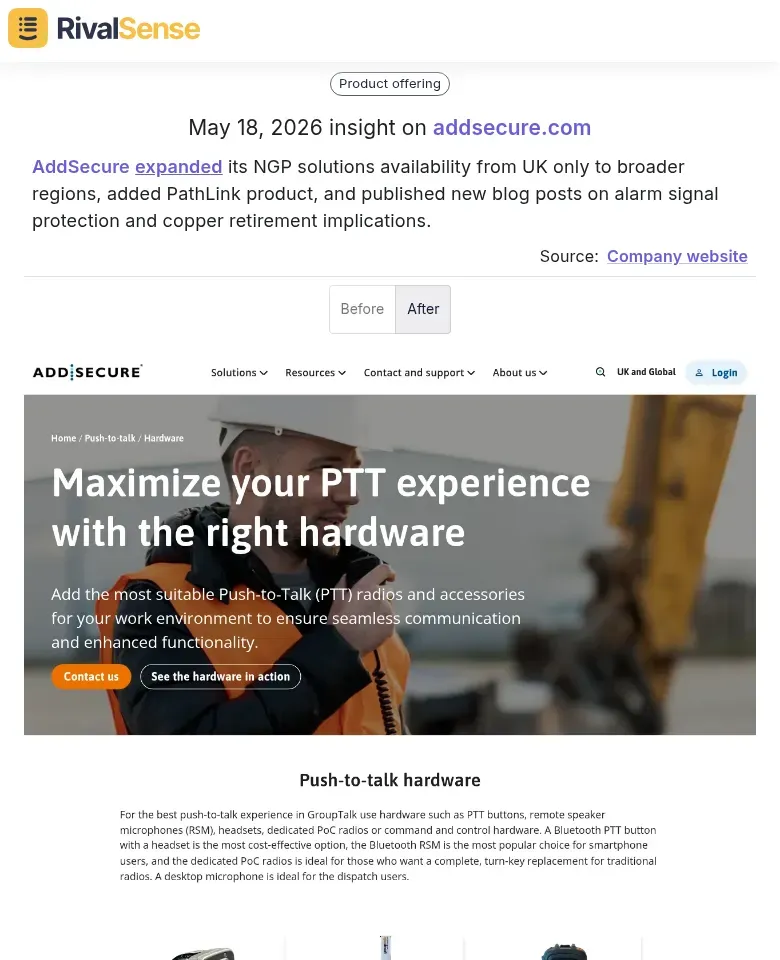
3. Product Expansion Insights – Expansions in product availability or new feature launches directly impact your competitive positioning. AddSecure expanded its NGP solutions availability from UK only to broader regions, added PathLink product, and published new blog posts on alarm signal protection and copper retirement implications. Understanding such moves helps you assess competitive threats and refine your product roadmap.
These kinds of signals are exactly the 20% that drive 80% of strategic decisions. Monitoring them systematically turns raw data into competitive advantages.
Technique 4: Leveraging AI Tools for Initial Drafts
Speed up your report creation by using AI to generate first drafts from raw data. Here’s how:
1. Use AI Summarizers for News & Reports
Feed competitor news articles, press releases, or financial filings into tools like ChatGPT, Claude, or specialized summarizers. Generate a concise bullet-point summary of key developments.
2. Automate Metric Extraction
For financial reports, use AI to pull critical numbers (revenue, growth %, customer count) into a structured table. Prompt example: “Extract all revenue figures, growth percentages, and customer numbers from this text. Output as a table.”
3. Generate a First Draft
Combine extracted metrics and summaries. Prompt: “Write a 200-word executive summary of the competitor’s quarterly performance, highlighting revenue changes, new product launches, and strategic shifts.”
4. Human Review & Refinement
Always review AI output for accuracy and strategic context. AI may miss nuance or misinterpret data. Add your own insights, competitive positioning, and implications for your strategy.
Pro Tip: Create a library of reusable prompts for common report sections (e.g., “Competitor product launch analysis”). This ensures consistency and saves time.
Technique 5: Collaborative Review Loops for Rapid Iteration
Speed up report finalization by replacing endless meetings with asynchronous review loops.
Set up shared documents (Google Docs, Notion, or Coda) where drafters, reviewers, and approvers work in parallel. Use comments and suggested edits instead of email threads.
Define clear roles to avoid bottlenecks:
- Drafter: Writes the initial summary from raw competitor data.
- Reviewer: Checks for accuracy, clarity, and completeness (e.g., a senior analyst).
- Approver: Gives final sign-off (e.g., head of strategy).
Implement version control and change logs to track edits efficiently. Tools like Google Docs’ version history or GitHub for markdown reports let you see what changed and revert if needed. Add a changelog table at the top of the document listing date, author, and summary of changes.
Pro tip: Set a 24-hour SLA for each review stage. Use @mentions to nudge reviewers and automated reminders via Slack/email. This keeps the loop tight without constant check-ins.
Checklist for rapid iteration:
- [ ] Shared doc with edit permissions
- [ ] Roles assigned in doc header
- [ ] Version history enabled
- [ ] Changelog template added
- [ ] Review SLA communicated
By structuring collaboration this way, you cut review time by up to 50% and produce cleaner, faster reports.
Your Next Step: Automate the Discovery
Applying these five techniques will dramatically speed up your competitor report creation. But there’s one bottleneck we haven’t addressed: finding those high-impact insights in the first place. Manually scanning websites, social media, and registries for every competitor is a drain on your team’s time.
That’s where RivalSense comes in. RivalSense tracks competitor product launches, pricing updates, event participations, partnerships, regulatory changes, management moves, and media mentions—across their website, social media, the internet, and various registries. All of it is delivered in a concise weekly email report, so you never miss a strategic signal.
Stop spending hours hunting for data. Let RivalSense do the heavy lifting, and apply the techniques above to turn those insights into fast, impactful reports.
👉 Try RivalSense for free and get your first competitor report today.
📚 Read more
👉 How a Rival Outpaced Broadcom by Tracking VMware Updates
👉 Unlock Competitor Insights on Facebook to Boost Key Account ROI
👉 AWS Competitor Monitoring: Workflow for Key Account Insights
👉 The Competitor Financial Intelligence Cheat Sheet: Decoding Funding, M&A, and Analyst Signals
👉 🚨 Competitor Watch: Ola, Uber & Rapido Face App Store Removal – What This Means for Your Business