
Benchmarking Key Account Win Rates in Commercial Banking
In commercial banking, revenue growth is a lagging scoreboard; win rates are the live game film. Because deals stretch over months and hinge on relationships, a declining win rate surfaces 6–12 months before revenue ever dips—making it the earliest, most honest signal of sales effectiveness and competitive positioning.
Unlike revenue growth (which can mask erosion behind a few large accounts) or client retention (which only tells you who stayed, not who you lost to), win rates expose hidden weaknesses: pricing rigidity, slow credit decisions, misaligned coverage, or a value proposition that has quietly lost its edge. If you're winning 30% of large-account opportunities while pipeline value climbs, the growth is an illusion.
Benchmark to see the truth. Compare against three cohorts: direct peers (same segments, similar size), regional banks (who often move faster on credit), and non-bank competitors like fintech lenders (who win on speed and data). Each reveals a different gap.
Practical steps:
- Track win rate by segment, product, and relationship tenure—not just the overall number.
- Log "lost to whom" on every loss to spot repeat rivals and patterns.
- Benchmark quarterly against peer disclosures and industry networks.
- Set thresholds: investigate any segment running 10 points below your peer cohort.
Win rates don't just measure performance—they predict it. Read them first.
Methodology: Building a Reliable Win-Rate Benchmarking Framework
Before you can improve your win rate, you need a measurement framework that everyone trusts. Without clear definitions, your benchmarks will be misleading. Here's how to build a reliable win-rate tracking system that can serve as the backbone for competitive analysis.
A win rate is only as trustworthy as the definitions behind it. Before comparing anything, lock down two definitions across every segment — mid-market, corporate, and institutional. A 'key account' should be anchored to objective criteria (e.g., revenue band, credit exposure, or strategic designation), not relationship-manager judgment. A 'win' must be equally precise: signed mandate, funded facility, or board-approved term sheet? Pick one trigger event and apply it uniformly, or your mid-market numbers will quietly overstate performance versus institutional deals with longer cycles.
Next, scope the benchmark deliberately. Use a rolling 12–24 month window to smooth out quarterly volatility and seasonal lending cycles. Set a minimum deal-size threshold so small-ticket wins don't distort the ratio, and build your comparison set from banks of similar size, geography, and product mix — comparing a regional lender to a global syndicator tells you nothing.
Finally, guard your data. CRM fields must be mandatory and validated at close; a deal registry is your source of truth for pipeline accuracy. Run lost-deal interviews within 30 days, while memory is fresh, and document reasons in a standardized taxonomy. Watch for self-reported bias: sales teams inflate 'winning' pipelines, so triangulate win rates against independently verified funding data. Practical tip: appoint a data steward to audit the process quarterly and publish a definitions checklist before any benchmark is shared with leadership.
Industry Benchmarks: What Good, Average, and Elite Win Rates Look Like
Once your data framework is set, the next step is knowing where you stand relative to peers. Industry benchmarks provide the context needed to turn internal numbers into strategic insight. Here's what commercial banks typically see across different segments.
In commercial banking, win rates cluster into three bands: good (15–20%), average (20–30%), and elite (35%+). But the number only means something once you segment it.
Deal complexity is the biggest swing factor. High-volume business banking and treasury product sales (under ~$50K revenue) typically close at 25–35%. Complex middle-market and large corporate credit deals — multi-stakeholder, 6–18 month cycles — drop to 10–18%. Elite lenders still convert one in five of those hard deals through disciplined qualification, not luck.
Relationship maturity matters just as much. New-to-bank acquisition (net new logos) wins at roughly 10–20%. Expansion into existing relationships wins at 30–40% — two to three times higher, because trust, data, and the credit file are already in place. If your expansion win rate sits below 30%, you're leaving money on the table with your best clients.
Practical benchmarking checklist:
- Segment before comparing: track business banking, middle market, and large corporate separately.
- Split win rates by new-to-bank vs. existing relationships — a blended rate hides both strengths and leaks.
- Count qualified opportunities only, and measure over a rolling four quarters to smooth volatility.
- Flag segments where you trail the market by 5+ points; investigate coaching, pricing, or product gaps there first.
- Protect segments where you outperform — they're your growth engine and your differentiation story.
Diagnosing the Root Causes Behind Your Win and Loss Patterns
Once you have benchmarked your win rates, the real diagnostic work begins. A number alone won't tell you why you're losing—you need to dig into the patterns behind each lost deal. Here's a structured approach to uncovering the root causes and turning those findings into a competitive edge.
When a key account slips away, the instinct is to blame price. But win/loss data across commercial banks shows the real culprits usually fall into five buckets: pricing (terms and structure, not just rate), product depth (missing capabilities like cash management or FX), credit appetite (risk limits versus the client's needs), relationship coverage (the spread and seniority of your calling team), and decision speed (credit committee turnaround).
Step 1: Separate controllable factors from structural conditions. Build a win/loss scorecard. For each lost mandate, tag the primary and secondary reason from the five buckets, then flag whether it was controllable (e.g., slow turnaround) or structural (e.g., a competitor's balance-sheet advantage in a specific sector). This prevents your team from over-reacting to headwinds they can't change — and under-reacting to ones they can.
Step 2: Mine competitor wins for strategy signals. If one rival keeps winning on speed, study their approval workflow and pricing authority — that's a sales motion you can counter. If they win on product depth, they're bundling adjacent services. Map their win patterns against your strengths to expose where you're systematically out-positioned.
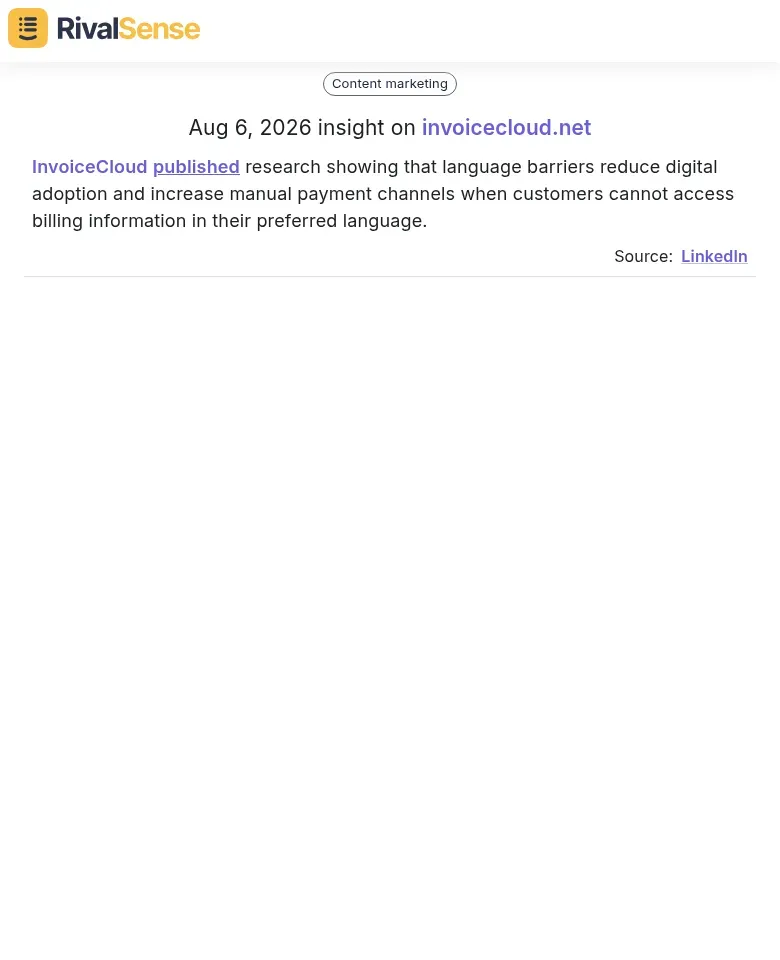
While direct win/loss data is crucial, don't ignore broader competitive intelligence. Occasionally, a rival will publish research that signals their future product direction. For example, RivalSense recently surfaced a study by InvoiceCloud showing that language barriers reduce digital adoption and push customers toward manual payment channels when billing isn't available in their preferred language. This type of insight is valuable because it telegraphs a competitor's likely next move—perhaps a multilingual product launch—which could affect your win rates among multicultural client segments if left unanswered.
Practical checklist: 1) Log every loss within 48 hours. 2) Interview the relationship manager, not just the client. 3) Track win rates by reason code quarterly. 4) Share patterns with product and credit teams. 5) Re-test your five biggest losses each quarter for changed assumptions.
From Benchmark to Strategy: Turning Data into a Competitive Advantage
Insights are worthless without action. This section bridges the gap between benchmarking data and operational changes that improve your competitive standing. Here's how to translate win-rate intelligence into a systematic advantage.
1. Set targets the whole deal team owns. Don't let win-rate targets live in a sales silo. Use benchmarks to set segmented goals by relationship tier, product line, and geography — then pressure-test them with credit and product before publishing. Tip: track "qualified" win rate separately from "total" win rate. Many banks chase vanity numbers that quietly hide credit declines and low-quality pipeline. A quarterly target-setting session where sales, credit, and product agree on one number upfront prevents finger-pointing when a deal falls apart.
2. Close the capability gaps benchmarks expose. Map where deals die. If losses cluster at the structuring stage, invest in deal-structuring training or credit pre-clearance workflows. If they surface after close, benchmark your digital onboarding speed against the top quartile and fix your slowest step. Build a 90-day gap-closure plan with one named owner per gap — no owner, no fix.
Beyond internal gaps, keep an eye on promotional tactics from competitors. A sudden, aggressive incentive can shift the playing field overnight. RivalSense recently spotted Fanatics offering a $2 million bounty on the Cooper Flagg 1/1 Rookie Debut Patch Auto card—a consumer move that illustrates how a large incentive can capture attention. In commercial banking, a competitor launching a similar cash bonus for new accounts or a fee waiver could tilt win rates in certain segments. Tracking such moves lets you adjust your own incentive structures proactively.

3. Build a competitor-tracking cadence. Win/loss insights decay fast. Run a monthly ritual: log every key-account loss, tag the competitor and the reason (price, terms, speed, relationship), and review trends quarterly. Feed those findings into pricing committee decisions, proposal templates, and relationship plans for your top 20 accounts.
Checklist: monthly loss tagging → quarterly trend review → annual benchmark refresh → refreshed pricing and proposals.
The banks that win aren't the ones with the best data — they're the ones that turn it into a weekly operating rhythm.
Pitfalls, Limitations, and the Future of Win-Rate Benchmarking
No metric is perfect. While win rates offer powerful insights, several pitfalls can lead you astray. This section covers what to avoid and where the industry is heading, so you can future-proof your benchmarking efforts.
Four common mistakes
- Small sample sizes. A 60% win rate across five deals means nothing. Track at least 30–50 opportunities per segment before drawing conclusions.
- Survivorship bias. Recording only deals you pursued — not those you never bid on — inflates your numbers. Log every opportunity, including no-bids.
- Incompatible segments. Comparing mid-market lending to large-cap syndications is apples-to-oranges. Segment by industry, deal size, geography, and product.
- Lagging data. Win rates tell you what happened last quarter, not what's happening now. Review monthly, not quarterly, and pair historical rates with pipeline momentum.
Why win rate alone is never enough
A high win rate can hide thin margins or tiny wallet share. Always triangulate: win rate × average margin × share of wallet × cycle time. Winning fast on unprofitable terms isn't a win. Build a scorecard that weights all four.
Where this is heading
- AI-driven deal scoring predicts likelihood-to-win per opportunity, letting bankers focus effort where it counts.
- Predictive analytics model competitor behavior — pricing shifts, product launches — before they hit your pipeline.
- Real-time competitive intelligence tools surface competitor moves as they happen, turning benchmarking from a rearview mirror into a forward radar. For instance, RivalSense recently captured that Leya will be at ILTACON in Nashville this August with live demos and an interactive workshop at booth 627. This kind of event intelligence is valuable because it flags an upcoming product push—if a banking competitor books a similar conference appearance, you can prepare your team to counter their messaging or even attend to gather firsthand insights.

Quick checklist: log every deal, segment ruthlessly, track four metrics together, refresh monthly, and let AI flag anomalies before you do.
Ready to turn competitive signals into a strategic advantage? Try RivalSense for free and start monitoring the moves that matter—from product launches to event appearances. Get your first competitor report today and see what your rivals are planning next.
📚 Read more
👉 Revolut’s New Device Rules Hand Privacy-First Rivals an Opening
👉 How Instagram Reveals Competitor Differentiators: A Comparative Analysis
👉 Fusion Energy Competitive Intelligence: Decoding Partnership, Thought Leadership & Event Signals
👉 Market Entry 101: Why Customers Choose Your Competitors
👉 From Bus Routes to Business Insights: A Competitor Analysis Example