Key Account Performance Dashboard: The Ultimate Guide for Strategic Account Management
In today's competitive B2B landscape, key accounts represent your most valuable revenue streams and strategic partnerships. Yet many organizations struggle with the fundamental challenge: how do you effectively monitor and optimize performance across your most important customer relationships?
A well-designed key account performance dashboard transforms scattered customer data into actionable intelligence, enabling account teams to proactively manage relationships, identify growth opportunities, and prevent churn before it happens.
What is a Key Account Performance Dashboard?
A key account performance dashboard is a centralized visualization tool that tracks the health, engagement, and business value of your most important customer accounts. Unlike generic sales dashboards, these specialized interfaces focus specifically on the metrics that matter for strategic account management.
Key characteristics:
- Real-time visibility into account health and engagement
- Cross-functional metrics spanning sales, customer success, and product usage
- Predictive indicators for retention risk and expansion opportunities
- Customized views for different stakeholders (account managers, executives, customer success teams)
Why Your Organization Needs Key Account Dashboards
Without dedicated monitoring, subtle warning signs often go unnoticed until it's too late. A key account dashboard surfaces early indicators like declining product usage, reduced engagement, or negative sentiment trends that might otherwise be buried in separate systems.
🛡️ 1. Prevent Revenue Leakage from High-Value Accounts
Practical tip: Set up automated alerts for when key account metrics drop below established thresholds. For example, if product adoption decreases by 20% month-over-month or support ticket volume spikes unexpectedly.
📈 2. Identify Expansion Opportunities Proactively
Your best growth opportunities often come from existing customers. A well-structured dashboard highlights expansion signals like increased usage patterns, positive feedback, or organizational changes that create new buying centers.
Checklist for identifying expansion opportunities:
- [✅] Monitor product adoption rates across different departments
- [✅] Track usage frequency and feature utilization
- [✅] Watch for organizational growth or restructuring
- [✅] Monitor customer sentiment and NPS scores
- [✅] Track engagement with your success team and resources
🤝 3. Align Cross-Functional Teams Around Account Success
Key accounts involve multiple touchpoints across sales, customer success, support, and product teams. A shared dashboard creates a single source of truth, eliminating conflicting information and ensuring everyone works toward the same account objectives.
Essential Components of an Effective Key Account Dashboard
An effective key account dashboard is built on a foundation of carefully selected metrics and intuitive design. It should provide a holistic view of account health while enabling quick decision-making for account managers and executives.
📊 Core Metrics to Track
Financial Health Metrics:
- Monthly/Quarterly revenue and growth trends
- Contract value and renewal dates
- Profitability and margin analysis
- Payment history and terms compliance
Engagement & Usage Metrics:
- Active users and adoption rates
- Feature utilization patterns
- Support ticket volume and resolution times
- Training and resource engagement
Relationship Health Indicators:
- Net Promoter Score (NPS) and customer satisfaction
- Executive sponsorship and relationship mapping
- Strategic alignment and business outcomes achieved
- Communication frequency and quality
Strategic Growth Indicators:
- Expansion pipeline and opportunities
- Referral and advocacy potential
- Competitive landscape within the account
- Organizational changes and new stakeholders
🎨 Dashboard Layout Best Practices
Step-by-step dashboard design:
-
Executive Summary View (Top Section)
- Overall account health score
- Revenue trends and key milestones
- Critical alerts and action items
-
Financial Performance Section
- Revenue breakdown by product/service
- Contract details and renewal timeline
- ROI and business value metrics
-
Usage & Engagement Section
- Product adoption heatmaps
- Support and success interactions
- Training and resource utilization
-
Relationship Health Section
- Stakeholder engagement matrix
- Sentiment analysis and feedback
- Strategic alignment indicators
Pro tip: Use color coding consistently—green for healthy metrics, yellow for caution areas, red for critical issues requiring immediate attention. 🟢🟡🔴
Building Your Key Account Performance Dashboard: Practical Steps
Creating a key account dashboard requires a structured approach to ensure it meets your business needs. Start by defining clear objectives and gradually integrate data sources for a seamless implementation.
🚀 Step 1: Define Your Account Tiers and Objectives
Not all accounts deserve the same level of dashboard sophistication. Start by categorizing your accounts:
- Strategic Accounts (Top 10-20%): Full comprehensive dashboard
- Growth Accounts (Next 30%): Core metrics dashboard
- Maintenance Accounts: Basic health monitoring
Actionable framework: Create account tier definitions based on revenue potential, strategic importance, and growth trajectory.
🔗 Step 2: Identify Data Sources and Integration Points
Key account data typically lives across multiple systems:
- CRM (Salesforce, HubSpot): Contract details, revenue data, contact information
- Customer Success Platforms (Gainsight, ChurnZero): Usage data, health scores, success plans
- Support Systems (Zendesk, Intercom): Ticket volume, response times, satisfaction scores
- Product Analytics (Mixpanel, Amplitude): Feature usage, adoption patterns
- Financial Systems: Billing, payment history, profitability
Integration checklist:
- [✅] Map all relevant data sources for each account tier
- [✅] Establish data refresh schedules (real-time for critical metrics, daily for others)
- [✅] Implement data validation and quality checks
- [✅] Set up automated alerts for data pipeline failures
👥 Step 3: Design Role-Based Views
Different stakeholders need different information:
Account Manager View:
- Daily engagement metrics
- Upcoming tasks and touchpoints
- Relationship health indicators
- Expansion opportunities
Executive View:
- Portfolio-level performance
- Risk assessment across key accounts
- Strategic initiative progress
- Competitive positioning
Customer Success View:
- Product adoption trends
- Support ticket patterns
- Training and onboarding progress
- Success plan milestones
🔔 Step 4: Implement Proactive Monitoring and Alerts
Critical alerts to configure:
- Revenue at risk (contracts expiring within 90 days)
- Usage drops exceeding 25% month-over-month
- Support ticket escalation patterns
- Negative sentiment in communications
- Key stakeholder departures or role changes
Advanced Features for Next-Level Account Management
Understanding your position within key accounts requires knowing what competitors are doing. While traditional dashboards focus on internal metrics, the most sophisticated account managers track external factors too.
🕵️ Competitive Intelligence Integration
Tools like RivalSense can enhance your key account dashboards by automatically tracking competitor activities—product launches targeting your accounts, pricing changes, executive movements, and partnership announcements that might impact your strategic relationships. This external context transforms internal metrics into competitive intelligence.
Real-world examples:
- New Service Launches: Tracking American Airlines' announcement of new seasonal service between New York and Edinburgh in March 2026 can alert you to competitor expansions.
 This insight is valuable because it helps you anticipate market shifts and protect your key accounts from competitor encroachment in the travel or logistics sectors.
 - Route Expansions: Japan Airlines announced JTA's first international flight from Okinawa (Naha) to Taipei (Taoyuan) launching on October 30, 2025.
 Monitoring such developments allows you to adjust your strategies for accounts in affected regions, ensuring you stay ahead of competitive threats and leverage new opportunities.
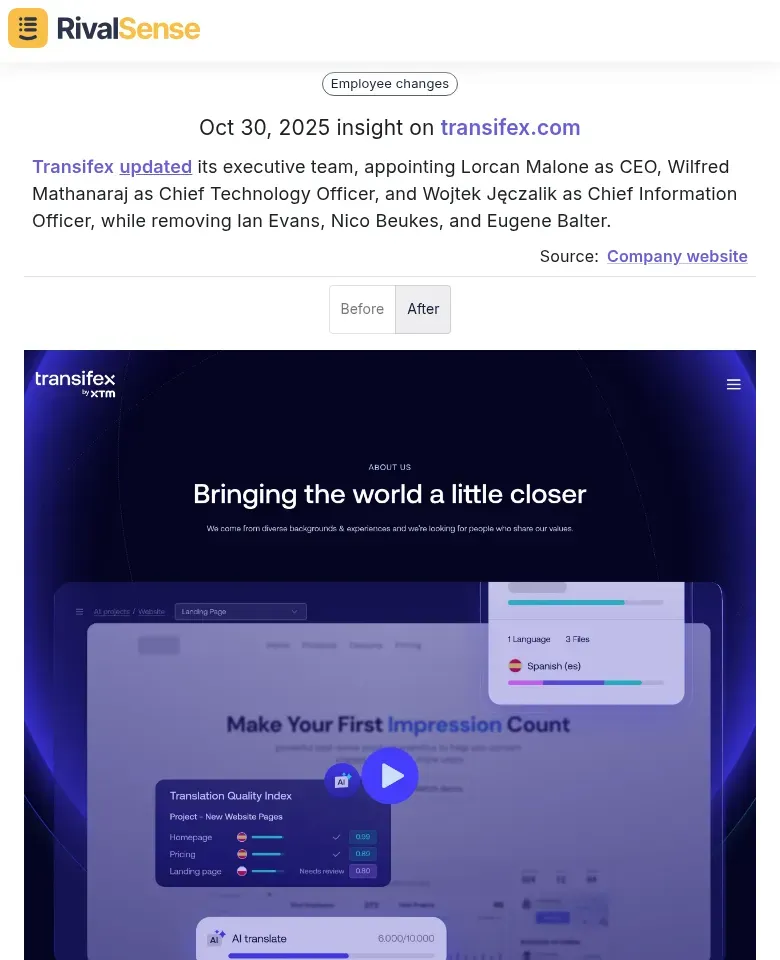
 - Executive Team Changes: Transifex updated its executive team, appointing Lorcan Malone as CEO, Wilfred Mathanaraj as Chief Technology Officer, and Wojtek Jęczalik as Chief Information Officer, while removing Ian Evans, Nico Beukes, and Eugene Balter.
 This type of insight is crucial as executive movements can indicate strategic pivots or vulnerabilities in competitors, enabling you to tailor your approach to key accounts and capitalize on potential disruptions.
🔮 Predictive Analytics and Risk Scoring
Move beyond reactive monitoring to predictive management:
- Churn risk scoring based on usage patterns, support interactions, and engagement metrics
- Expansion probability algorithms identifying accounts ready for upsell
- Relationship health forecasting based on communication patterns and sentiment analysis
⚙️ Automated Reporting and Stakeholder Updates
Time-saving automation:
- Scheduled executive briefings for key accounts
- Automated stakeholder update emails
- Quarterly business review preparation templates
- Custom reporting for different internal audiences
Common Pitfalls and How to Avoid Them
Even the best-designed dashboards can fail if common mistakes are not addressed. Being aware of these pitfalls and implementing preventive measures is key to long-term success.
❌ Mistake #1: Information Overload
Problem: Including too many metrics that don't drive action
Solution: Apply the "So what?" test to every metric. If a metric changes, what specific action would you take? If there's no clear answer, remove it.
❌ Mistake #2: Static Dashboards
Problem: Building dashboards once and never updating them
Solution: Schedule quarterly dashboard reviews with account teams to ensure metrics remain relevant as business priorities evolve.
❌ Mistake #3: Ignoring External Factors
Problem: Focusing only on internal metrics while missing competitive threats
Solution: Incorporate market intelligence and competitor tracking to understand the full context of account relationships.
❌ Mistake #4: Poor Data Quality
Problem: Inaccurate or outdated data undermining dashboard credibility
Solution: Implement data governance processes and regular reconciliation with source systems.
Implementation Roadmap: Getting Started
A phased approach to dashboard implementation ensures smooth adoption and continuous improvement. Start small, gather feedback, and scale based on proven results.
📅 Phase 1: Foundation (Weeks 1-4)
- Select 3-5 pilot accounts for initial dashboard development
- Identify core metrics and data sources
- Build basic dashboard structure
- Train pilot users and gather feedback
📈 Phase 2: Scaling (Weeks 5-12)
- Expand to additional strategic accounts
- Refine metrics and visualizations based on feedback
- Implement automated alerts and reporting
- Develop role-based views for different stakeholders
🔄 Phase 3: Optimization (Ongoing)
- Incorporate advanced features (predictive analytics, competitive intelligence)
- Regular review and refinement cycles
- Integration with strategic planning processes
- Continuous training and adoption monitoring
Measuring Dashboard Success
To ensure your key account dashboard delivers value, track specific performance indicators that reflect its impact on account management efficiency and effectiveness.
Key performance indicators for your dashboard implementation:
- Account manager adoption rate (% of team using dashboard regularly)
- Time saved on manual reporting (hours per week)
- Early risk identification (days/weeks before issues escalate)
- Expansion opportunity identification rate
- Account retention improvement
The Future of Key Account Management Dashboards
As AI and machine learning continue to advance, expect key account dashboards to evolve from monitoring tools to proactive advisors. These advancements will empower account teams to be more data-driven and strategic in their decision-making.
- AI-powered recommendations for engagement strategies
- Automated relationship scoring based on communication analysis
- Predictive expansion modeling identifying untapped opportunities
- Competitive threat detection alerting to competitor movements in your accounts
Strategic insight: The most successful account teams will leverage tools that combine internal performance data with external market intelligence, creating a complete picture of each key account's potential and risks.
Getting Started with Your Key Account Dashboard
Begin with your most critical accounts and focus on the metrics that directly impact retention and growth. Remember that the most effective dashboards evolve over time as you learn what information drives the best account management decisions.
Final checklist for implementation:
- [✅] Identify your top 10 strategic accounts for initial focus
- [✅] Map data sources and establish integration points
- [✅] Define core metrics aligned with business objectives
- [✅] Design role-based views for different stakeholders
- [✅] Implement automated alerts for critical metrics
- [✅] Schedule regular review and refinement cycles
- [✅] Consider external intelligence sources for competitive context
To enhance your key account dashboards with real-time competitor insights and stay ahead of market changes, try RivalSense for free today and get your first competitor report. Visit https://rivalsense.co/ to start tracking competitor activities that impact your strategic accounts.
By implementing a comprehensive key account performance dashboard, you transform account management from reactive firefighting to strategic partnership building, ensuring your most valuable customer relationships deliver maximum business value.
📚 Read more
👉 Advanced Tactics to Analyze Competitor Marketing Strategy on Influencer Platforms
👉 How Reddit's Legal Action Against Perplexity AI Revealed Competitor Vulnerabilities
👉 LinkedIn Trend Analysis: Uncover Competitor Pricing Advantages
👉 Quick Tips: Key Account Assessment Hacks for Construction Leaders
