
Build Key Account Performance Dashboards for Fintech B2B
Key account performance dashboards are centralized visual tools that track critical metrics for high-value B2B clients in fintech, such as transaction volume, revenue contribution, service usage, and client health scores. In the competitive fintech landscape, these dashboards are vital for proactive account management, enabling data-driven decisions to boost revenue and retention. For instance, by monitoring real-time payment processing trends, you can identify upsell opportunities or address churn risks early.
These dashboards drive growth by highlighting revenue streams—like spotting underutilized API features that could be promoted—and enhance retention through alerts on declining engagement, allowing timely interventions. Without them, teams face challenges: scattered data leads to reactive responses, manual reporting wastes time, and missed signals result in client attrition. Common pitfalls include lack of integration with CRM systems, inconsistent metric tracking, and poor visualization that obscures insights.
Practical steps: Start by defining key metrics (e.g., monthly recurring revenue, support ticket resolution time), integrate data from sources like payment gateways, and use tools like Tableau for clear visuals. 💡 Tip: Automate alerts for metric thresholds to act swiftly.
Checklist:
- ✅ Identify top 10 accounts
- ✅ Set quarterly review cycles
- ✅ Train teams on dashboard interpretation to turn data into actionable strategies
Essential Metrics to Track in Your Dashboard
For fintech B2B key account dashboards, focus on these essential metrics to ensure comprehensive monitoring. Track KPIs like transaction volume (e.g., monthly payment processing value) and client engagement (e.g., login frequency, feature usage) to gauge account health and potential growth areas. Financial metrics should include revenue per account (RPA) and profitability analysis—calculate RPA by dividing total revenue by active accounts, and assess profitability by subtracting costs like transaction fees.
Operational metrics are critical for reliability and compliance: monitor service uptime (aim for 99.9%+ with tools like Pingdom) and adherence to regulations (e.g., track audit completion rates). 📊 Practical tips: Use real-time alerts for downtime, set quarterly reviews for KPIs, and integrate data from APIs for accuracy.
Checklist:
- ✅ Define clear targets for each metric
- ✅ Automate data collection processes
- ✅ Visualize trends with interactive charts and graphs
Steps to Build an Effective Dashboard
Building an effective key account performance dashboard for fintech B2B requires a structured approach to ensure scalability and usability. Start by selecting the right tools and technologies—opt for platforms like Tableau or Power BI for visualization, and ensure compatibility with APIs from CRM systems (e.g., Salesforce) and financial data sources for seamless integration. Prioritize scalability to handle real-time data streams without performance issues.
Next, design user-friendly interfaces tailored for business leaders: use clear, intuitive layouts with customizable widgets, avoid clutter, and include key metrics like customer lifetime value and churn rates at a glance. Incorporate interactive filters for drill-down analysis to empower decision-making. For data integration, map all sources—transaction databases, marketing automation tools, and external market data—using ETL processes or middleware. Implement real-time updates through webhooks or streaming services (e.g., Kafka) to ensure accuracy; set up alerts for anomalies to enable proactive responses. 🛠️ Practical tips: Create a checklist for data validation, test dashboards with end-users for feedback, and schedule regular reviews to adapt to evolving business needs.
Leveraging Competitor Insights for Dashboard Enhancement
In fintech B2B, competitor analysis reveals dashboard best practices and gaps that can inform your strategy. By tracking rival activities, you can benchmark your performance, identify emerging trends, and adapt your dashboards to stay competitive. For example, monitoring product launches, event participations, or partnerships provides real-time intelligence on market shifts and innovation.
Here are real-world insights from RivalSense that highlight the value of competitor tracking for business strategy:
-
Webshare has added new proxy locations in Colombia, Iran, Kenya, South Korea, Kuwait, Nigeria, Qatar, Saudi Arabia, and Venezuela.
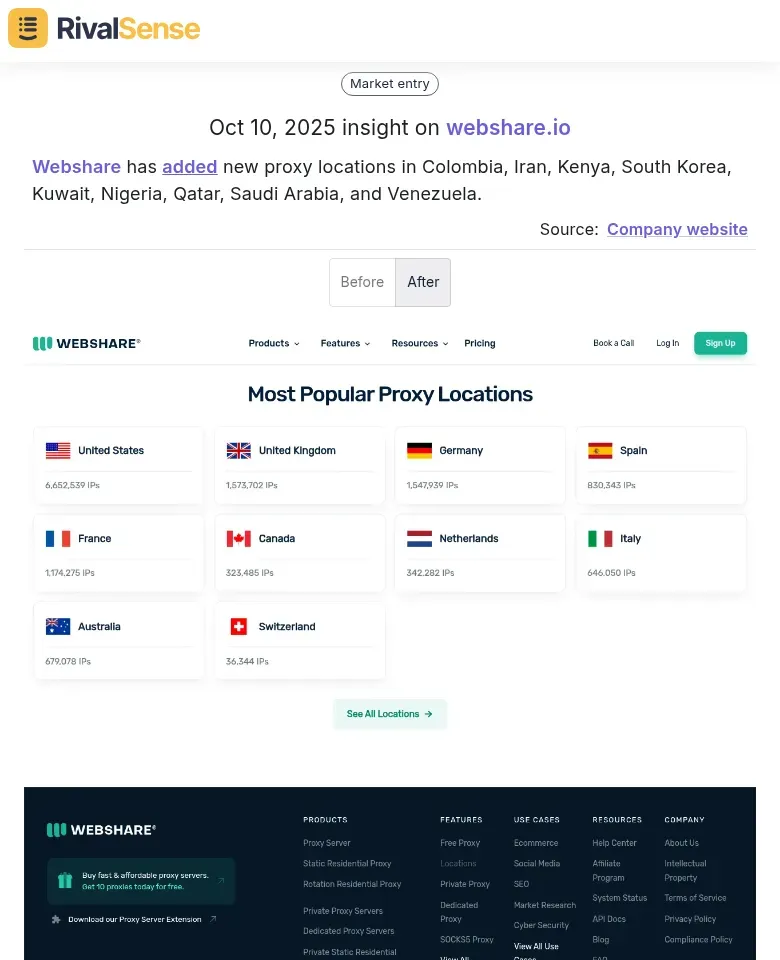
This type of insight is valuable for understanding competitor expansion into new geographic markets, which can prompt you to update your dashboard with regional performance metrics or explore similar growth opportunities. -
SmarterDx will present at AHIMA25 on October 12-14 in Minneapolis.

Tracking competitor event participations helps you identify key industry gatherings and assess rival visibility, allowing you to refine your own event strategies and incorporate engagement metrics into your dashboard. -
Cathay Pacific launched Tripment, an AI tool featuring Dr Teck M.C. that diagnoses workplace ailments and prescribes trips, offering a flight promo code and a chance to win 30,000 Asia Miles in a Singapore contest.
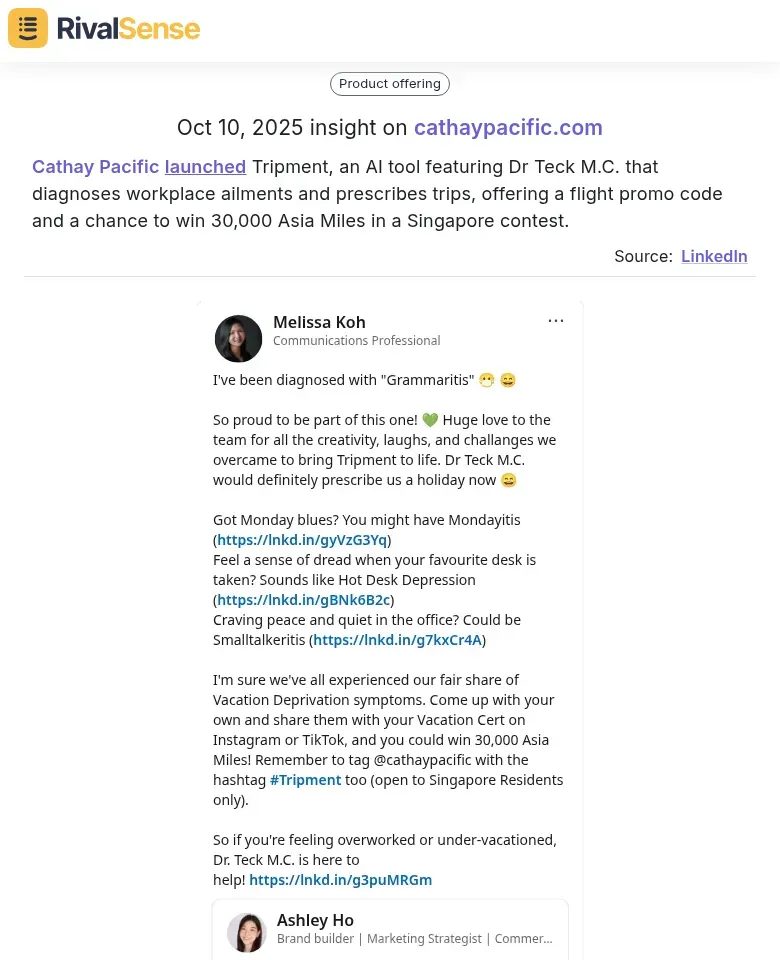
This product launch insight showcases innovation in AI and customer engagement, signaling trends that could influence your dashboard features, such as adding AI-driven analytics or tracking competitive threats in real-time.
Use these insights to benchmark your dashboard against competitors. Practical steps:
- 📋 Create a competitor feature checklist (e.g., drill-down capabilities, mobile responsiveness)
- 🔄 Run A/B tests on dashboard layouts inspired by top performers
- 📈 Monitor market shifts—like new regulatory requirements—to update metrics promptly
Best Practices for Implementation and Adoption
Implementing key account dashboards requires strategic adoption to maximize their value across your organization. Start with comprehensive training: conduct hands-on workshops showing teams how to interpret metrics like client engagement scores and revenue trends, and create quick-reference guides with real examples—e.g., 'A 10% drop in login frequency may signal churn risk.' Assign dashboard champions to provide ongoing support and foster a data-driven culture.
Ensure data integrity and compliance to build trust and avoid risks: validate sources daily, encrypt sensitive client data, and adhere to regulations like GDPR or financial standards. Use automated checks for anomalies and conduct quarterly security audits to maintain reliability. Iterate based on feedback to keep dashboards relevant: gather input via surveys or user interviews, and if sales teams request faster pipeline views, add visual filters or streamline data access. Regularly update dashboards to reflect evolving business goals, testing changes with a pilot group first to ensure smooth transitions. 🔁 Cycle of improvement: Training → Security → Refinement for sustained value.
Conclusion: Driving Business Success with Performance Dashboards
Performance dashboards are essential for fintech B2B leaders, offering real-time insights into key account metrics like revenue growth, churn rates, and customer engagement. By centralizing data, they enable proactive decision-making, enhance client retention, and uncover competitive advantages—such as spotting market shifts or benchmarking against rivals. Looking ahead, trends include AI-driven predictive analytics, automated competitive intelligence tools, and integration with IoT for deeper client behavior analysis.
To get started, founders and CEOs should:
- 🎯 Identify critical KPIs (e.g., lifetime value, acquisition cost)
- 🛠️ Use customizable dashboard tools (like Tableau or Power BI)
- 📅 Implement regular reviews with teams
- 🔍 Leverage competitor tracking to anticipate industry trends
Begin with a pilot dashboard, iterate based on feedback, and scale to drive sustained business success. To assist with tracking competitor moves and enhancing your dashboards, try out RivalSense for free at https://rivalsense.co/ and get your first competitor report today!
📚 Read more
👉 How Xometry's Mobile App Launch Prompted Competitor Innovation
👉 Data-Driven Website Insights: Boost Key Account Performance
👉 Key Account Tracking Customization: Strategic Insights from Penneo vs. Competitors
👉 Leverage Competitor Pricing Insights from Customer Reviews
👉 How Executive Moves Reveal Competitor Strategies: A Practical Guide