
Streamline Education Stakeholder Management with Key Account Dashboards
Managing education stakeholders has become increasingly complex in today's multi-layered educational landscape. Schools and multi-academy trusts must navigate relationships with parents, students, staff, governors, local authorities, and regulatory bodies—each with distinct needs and communication preferences. Traditional reporting methods, often relying on fragmented spreadsheets and delayed paper reports, fail to provide the timely, actionable insights decision-makers need to respond to emerging challenges.
Practical Tip: Start by mapping all your stakeholder groups and their specific information needs. Create a simple matrix showing what data each group requires and how frequently they need updates.
Centralized key account dashboards offer a strategic solution by consolidating critical metrics into a single, accessible interface. These dashboards transform raw data into visual insights that enable proactive decision-making rather than reactive responses. For multi-academy trusts, this means consistent oversight across multiple institutions while allowing for localized adaptations.
Actionable Checklist:
- Identify your 5-7 most critical stakeholder metrics
- Determine update frequency for each data point
- Choose visualization formats that enhance understanding
- Establish clear data governance protocols
- Plan for stakeholder training and adoption support
By implementing structured dashboard systems, educational leaders can move from managing crises to anticipating needs, fostering stronger relationships through transparent, data-informed communication.
Key Account Dashboards: A Strategic Framework for Education Leaders
Key account dashboards provide a centralized platform for monitoring and managing stakeholder relationships in education. By visualizing critical metrics, these dashboards enable leaders to make informed decisions and communicate effectively with diverse groups. Design stakeholder-specific dashboards tailored to different education audiences. For trust leaders, focus on multi-academy trust performance metrics, financial health, and compliance indicators. Governors need governance oversight dashboards with student outcomes, safeguarding compliance, and budget utilization. Department heads require curriculum-specific views showing attainment gaps, intervention effectiveness, and resource allocation.
Practical checklist for dashboard design:
- [ ] Identify 3-5 critical metrics per stakeholder group
- [ ] Use color coding: green for targets met, amber for monitoring, red for intervention needed
- [ ] Include trend lines showing progress over academic terms
- [ ] Add contextual notes explaining data anomalies
Integrate evidence-led insights with honest feedback mechanisms. Combine quantitative data (assessment results, attendance rates) with qualitative feedback from staff surveys, parent forums, and student voice. Create a feedback loop where dashboard insights inform improvement plans, and stakeholder input refines dashboard metrics.
Tip: Schedule quarterly dashboard review sessions where stakeholders can question data validity and suggest metric adjustments. This builds trust and ensures dashboards reflect real institutional priorities.
Create flexible partnership models with 1-, 3-, and 5-year options. One-year models suit schools needing immediate intervention support. Three-year frameworks align with typical strategic planning cycles. Five-year partnerships work for trusts undergoing major transformation.
Implementation steps:
- Conduct stakeholder needs assessment workshops
- Prototype dashboard views for each audience
- Pilot with 2-3 departments or schools
- Gather feedback and refine metrics
- Scale across the institution with tailored training
Key success factor: Ensure dashboards drive action, not just monitoring. Each metric should have clear "so what" implications and linked improvement strategies.
Industry Insights: Learning from Education Technology Competitors
Staying ahead in the competitive EdTech space requires understanding how top players engage with stakeholders. By analyzing competitor strategies, you can identify best practices and adapt them to your own business. Leading EdTech companies excel at three strategic areas that you can emulate to strengthen stakeholder relationships:
-
Strategic Conference Participation: Top competitors don't just attend events—they dominate them. Research shows successful EdTech vendors use conferences for more than networking; they secure speaking slots and position themselves as thought leaders. For instance, RivalSense tracked that Edurio will participate in the Association of School and College Leaders Annual Conference 2026 on March 13-14 in Liverpool, with Ian Rowe and Danni Fothergill at Stand 74 and Ernest Jenavs delivering a workshop with Sian John from E-ACT.
 Understanding competitor conference activities is valuable for business strategy as it reveals their market focus and networking priorities, helping you plan your own event participation to maximize visibility.
Practical tip: Create a conference calendar 6-12 months in advance, targeting 3-5 key events annually where your target stakeholders congregate. Prepare case studies and data-driven insights to share, establishing credibility beyond product pitches.
-
Workshop Delivery with Educational Partners: Successful EdTech companies co-create value through workshops with schools and trusts, demonstrating collaborative expertise. As an example, RivalSense identified that Edurio will support trust leaders with honest feedback and evidence-led insight at the South East MATNetworks Event on February 5.
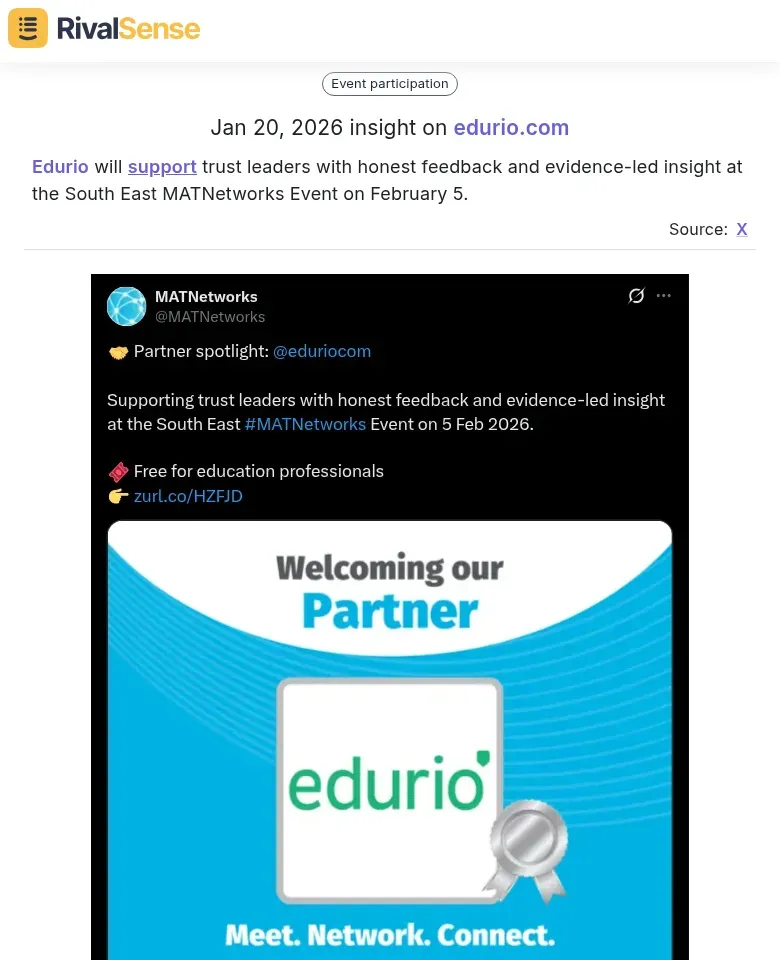 Tracking such workshop engagements is crucial because it shows how competitors build relationships and demonstrate expertise, allowing you to refine your own collaborative approaches and content offerings.
Actionable checklist: Identify 2-3 potential partner institutions, propose pilot workshop topics addressing their pain points, co-design content with their educators, and measure impact through pre/post assessments.
-
Tailored Pricing Structures: Education budgets follow distinct cycles, and competitors who succeed offer flexible pricing models. For example, RivalSense reported that Edurio now offers pricing for 1-, 3- and 5-year partnership options, tailored to the needs of schools or trusts.
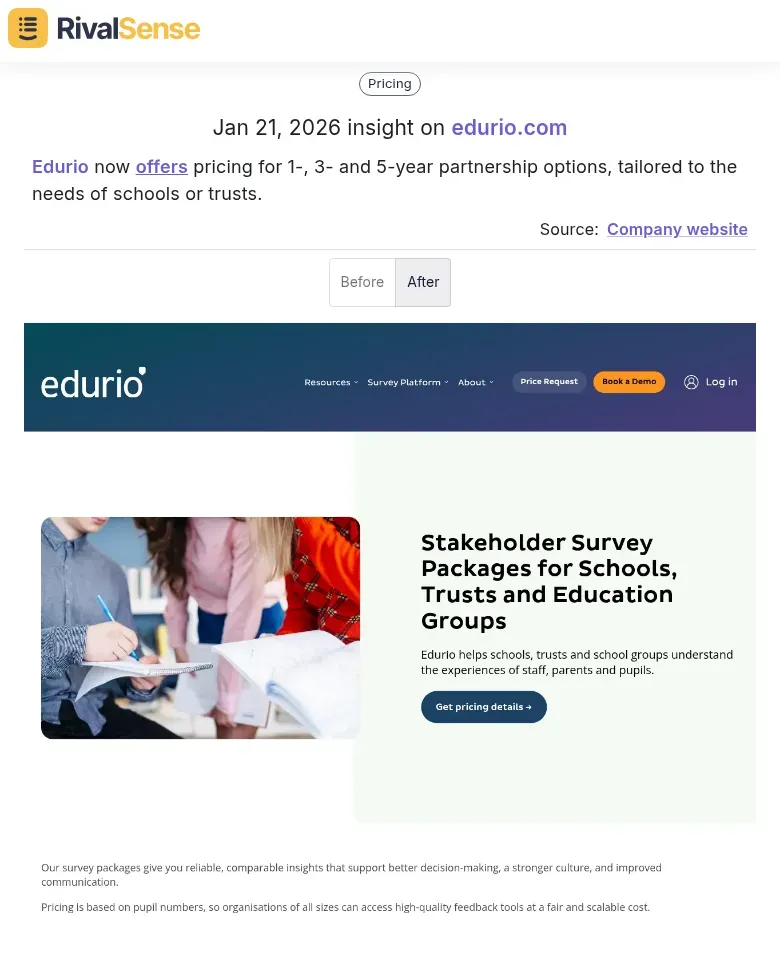 Monitoring pricing updates is essential for business strategy as it helps you understand competitor positioning and adjust your own pricing models to stay competitive and meet market demands.
Practical advice: Map your pricing to institutional budget cycles—offer Q1 proposals for annual budgets, Q3 renewals for next fiscal year planning, and flexible payment terms for grant-funded projects. Include options for phased implementation that align with academic calendars.
Key takeaway: Monitor competitors' partnership announcements, conference presentations, and pricing page updates using competitive intelligence tools. This intelligence helps you anticipate market trends and adapt your stakeholder management strategy accordingly.
Implementation Strategies for Multi-Academy Trusts and School Networks
Implementing key account dashboards across multi-academy trusts requires careful planning and execution. A structured approach ensures that all stakeholder needs are met while maintaining data integrity and usability. For Multi-Academy Trusts, start with a phased rollout: 1) Map all stakeholder groups (trustees, school leaders, governors, parents, community partners) and their data needs. 2) Design dashboards with dual-view capability - trust-level overviews showing regional trends alongside drill-down school-specific metrics. 3) Establish automated data feeds from school MIS systems, attendance records, and community engagement platforms.
Practical checklist:
- Create stakeholder-specific dashboard views with role-based permissions
- Include regional event calendars with participation tracking
- Build feedback collection modules directly into dashboards
- Set up automated alerts for stakeholder engagement milestones
- Implement quarterly review cycles to refine metrics
For feedback loops: Design structured input forms that categorize feedback by theme (facilities, curriculum, community relations). Use dashboard analytics to identify patterns, then create automated workflows that assign action items to relevant teams. Track implementation progress through the dashboard, closing the loop by sharing outcomes with stakeholders. This transforms passive data into active improvement plans while demonstrating transparent governance.
Measuring Impact: From Dashboard Data to Educational Outcomes
Effective stakeholder management requires moving beyond data collection to actionable insights. By translating dashboard metrics into meaningful outcomes, educational leaders can demonstrate value and drive continuous improvement. Start by identifying KPIs that matter most to each group: for administrators, track budget utilization and program completion rates; for faculty, monitor student engagement metrics and resource usage; for students and parents, focus on satisfaction scores and learning outcomes.
Transform dashboard data into strategic decisions with these steps:
- Set up automated alerts for critical KPI thresholds
- Create comparative views showing performance against benchmarks
- Schedule monthly review sessions with stakeholder representatives
- Document insights and action items in a shared decision log
Demonstrate ROI by connecting dashboard metrics to tangible outcomes. For example, when you see a 15% increase in faculty satisfaction scores, correlate this with improved student retention rates. When resource allocation shifts based on usage data, track the resulting improvements in program completion.
Practical tip: Create a stakeholder impact matrix that maps dashboard metrics to specific educational outcomes. This visual tool helps communicate how data-driven decisions lead to measurable improvements in stakeholder satisfaction and educational quality. Regularly update this matrix with real results to build trust and demonstrate continuous value.
Future Trends: The Evolution of Stakeholder Management in Education
The future of education stakeholder management is being reshaped by three transformative trends. These trends are driven by technological advancements and changing expectations from stakeholders. First, predictive analytics and AI integration are moving dashboards from reactive reporting to proactive intelligence. These systems can now forecast student performance trends, identify at-risk learners before they fall behind, and suggest personalized intervention strategies.
Second, there's an increasing demand for real-time, mobile-accessible stakeholder insights. School leaders now expect dashboard access on smartphones and tablets, enabling immediate decision-making during campus walks or meetings. This mobility transforms stakeholder engagement from scheduled reviews to continuous collaboration.
Third, transparent, evidence-based communication is becoming non-negotiable. Modern dashboards must provide clear, verifiable data that builds trust with all stakeholders—from parents to board members to community partners.
Practical steps to prepare:
- Audit your current data infrastructure for AI readiness
- Prioritize mobile-responsive dashboard design
- Develop clear data storytelling protocols for different stakeholder groups
- Implement regular stakeholder feedback loops on dashboard usability
- Create evidence-based communication templates for common scenarios
Start by identifying one predictive analytics use case relevant to your institution's strategic goals, then build outward from there.
Leverage Competitive Intelligence for Strategic Advantage
In today's fast-paced education market, keeping tabs on competitor movements can provide a critical edge in stakeholder management. By monitoring product launches, pricing updates, event participations, and partnerships, you can anticipate shifts and adapt your strategies proactively. Tools like RivalSense automate this tracking, delivering insights directly to your inbox.
To stay updated on competitor activities and enhance your stakeholder dashboards, try RivalSense for free at https://rivalsense.co/. Get your first competitor report today and transform how you monitor the education technology landscape.
📚 Read more
👉 Competitor Financial Analysis Templates: Fundraising & M&A Insights Framework
👉 Decoding Competitor Pricing Moves: A Real-World Analysis from Credifiel México
👉 The Strategic Advantage: 7 Key Benefits of a Dedicated Key Account Manager
👉 Beginner's Guide: Competitive Intelligence Software Benefits for IT Asset Management
👉 How Intel Countered NVIDIA's Visteon Deal with Edge AI Partnerships