
Extracting Financial Insights from Facebook Competitor Analysis
Facebook serves as an unparalleled goldmine for extracting financial intelligence about competitors, offering real-time insights that traditional financial reports often miss. With over 3 billion monthly active users, competitors' social activities translate directly into measurable financial indicators: ad spending patterns reveal budget allocations, engagement rates signal market positioning strength, and campaign performance metrics indicate ROI efficiency. For instance, tracking a competitor's Facebook ad frequency and estimated spend (using tools like Facebook Ad Library) can uncover their customer acquisition costs and marketing strategy shifts.
📊 Practical tip: Start by identifying 3-5 key competitors and monitor their Facebook Business pages daily—note post frequency, content types, and engagement spikes, which often precede product launches or promotional campaigns. This real-time data provides actionable financial insights, helping you benchmark performance and anticipate market moves before they impact your bottom line.
Key Financial Metrics to Track from Competitor Facebook Activities
Facebook competitor analysis reveals crucial financial insights beyond surface-level metrics. Here's how to extract actionable intelligence:
Investment Patterns through Event Sponsorships
Track competitors' event sponsorships and expansion announcements to gauge capital allocation. Monitor their Facebook event pages and partnership posts - frequent high-value sponsorships indicate strong cash flow and aggressive market positioning.
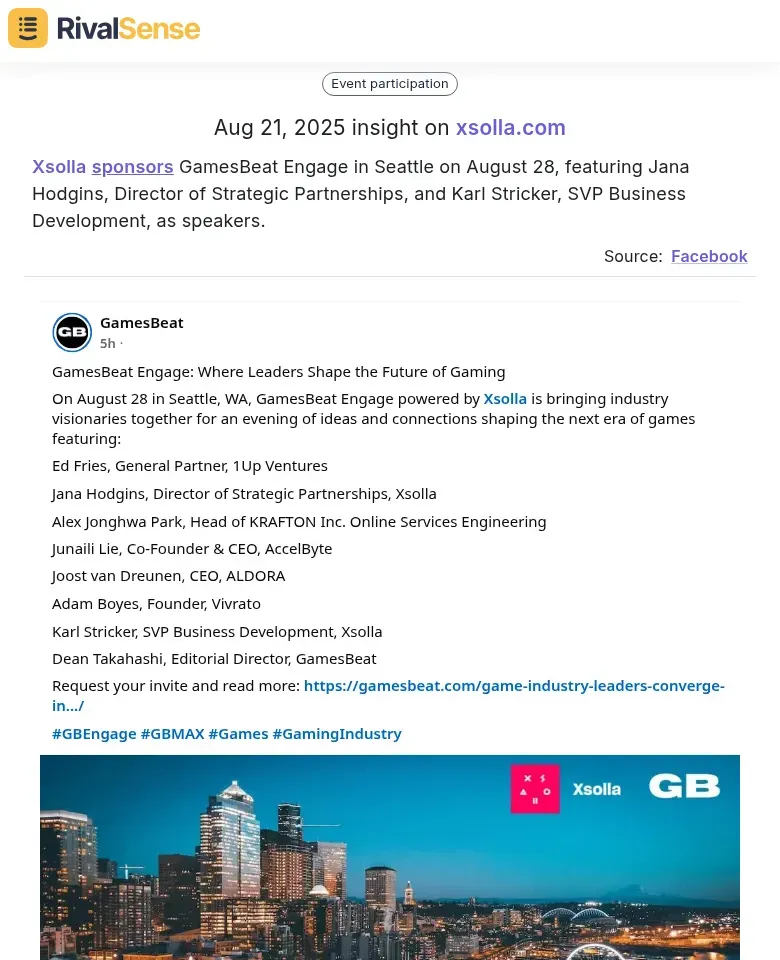
Example: Xsolla sponsors GamesBeat Engage in Seattle on August 28, featuring key executives as speakers. Tracking such sponsorships helps understand competitors' market positioning and partnership strategies, revealing their investment priorities and target markets.
Recruitment Trends as Growth Indicators
Analyze hiring patterns through Facebook career pages and recruitment posts. A surge in technical roles suggests R&D expansion, while sales hires indicate market penetration goals.
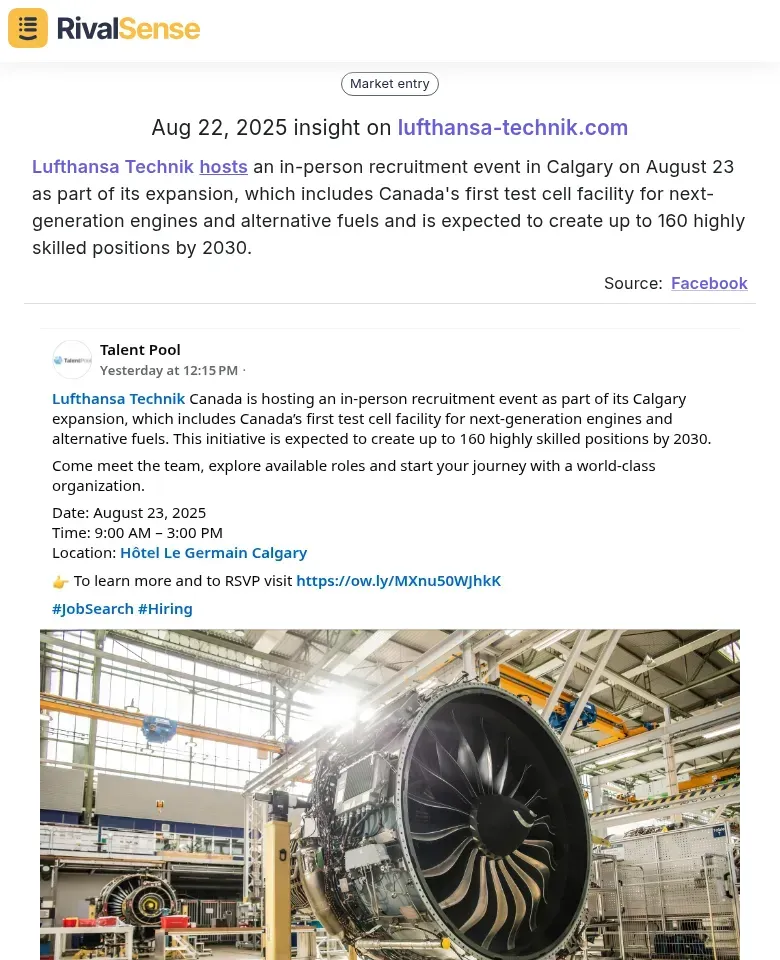
Example: Lufthansa Technik hosts recruitment events as part of expansion plans. Monitoring such activities provides insights into competitors' growth strategies, operational scaling, and market entry timing, helping you anticipate competitive pressures.
Product Updates and R&D Spending
Monitor product announcement frequency and engagement levels. High-engagement launch posts typically correlate with substantial R&D investment. Track update cadence - regular major releases suggest consistent R&D budgeting.
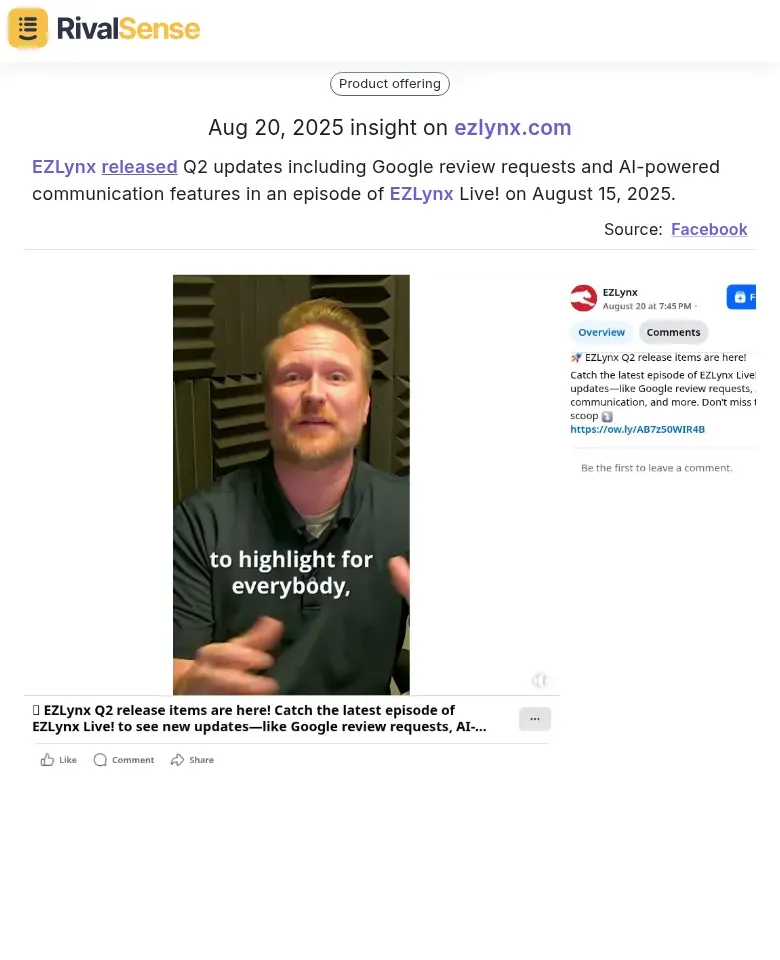
Example: EZLynx released Q2 updates including AI-powered features. Tracking product updates helps understand competitors' innovation pace, technology adoption, and R&D focus areas, enabling better resource allocation decisions.
✅ Checklist for Financial Intelligence:
- Log event sponsorship values and frequencies
- Track hiring volume by department monthly
- Document product release engagement metrics
- Compare your investment patterns against competitors'
- Use Facebook Insights to benchmark growth rates
These metrics transform social media monitoring into strategic financial intelligence, helping you anticipate market moves and optimize your own resource allocation.
Extracting Investment and Expansion Signals from Competitor Events
Competitor events provide invaluable financial intelligence for strategic planning. Analyze in-person events to estimate market entry costs—note venue size, attendee count, and production quality to benchmark expansion budgets. For example, a competitor's large-scale conference with premium venues signals significant capital allocation to new markets.
Facility announcements reveal capital expenditure strategies. Track new office openings, manufacturing plants, or data centers to understand long-term investment commitments. A competitor announcing a 100,000 sq ft facility suggests multi-million dollar CAPEX, indicating aggressive growth plans you should factor into your financial forecasts.
Hiring projections offer operational scaling insights. Monitor job postings for volume, roles, and locations. A competitor advertising 200+ new positions in a region signals substantial operational investment—calculate associated costs (salaries, training, infrastructure) to anticipate their financial commitments and competitive pressure.
📋 Practical Checklist:
- Document event scale and estimated costs
- Map facility expansions to CAPEX timelines
- Quantify hiring projections into operational budgets
- Compare against industry benchmarks
- Update financial models quarterly with new signals
Leveraging Product Updates for R&D and Innovation Insights
Product updates reveal critical R&D investment patterns. Track feature release frequency—monthly updates suggest aggressive R&D, while quarterly releases indicate measured investment. For example, tech companies' weekly AI feature deployments signal heavy R&D focus on automation.
Analyze technology adoption through AI announcements. When competitors announce AI integrations, note the sophistication level: basic automation suggests early-stage investment, while advanced machine learning indicates mature R&D. Monitor patent filings alongside announcements for validation.
Benchmark innovation cycles against industry standards. Tech companies typically release major updates every 3-6 months. Faster cycles (1-2 months) indicate competitive aggression, while slower cycles (6+ months) may signal resource constraints.
📊 Tracking Template:
| Competitor | Update Date | Feature Type | R&D Intensity |
|---|---|---|---|
| Example | 2025-08-15 | AI/Advanced | High |
🔧 Practical tip: Set up alerts for competitor + "AI launch" or "new feature" to capture real-time signals. Compare your innovation velocity—if competitors release 2x faster, consider accelerating your R&D cycle.
Practical Tools and Methods for Financial Data Extraction
To extract financial insights from Facebook competitor analysis, start with Facebook's native tools. Use the Meta Ad Library to analyze competitors' ad spend patterns—search by competitor names to see active campaigns, estimated budgets, and ad frequency. This reveals their investment levels and targeting strategies.
Implement third-party tools for comprehensive financial metrics, including ad performance benchmarks and consumer spending data. Set up automated alerts for competitor campaign launches or budget changes to stay updated in real-time.
💡 Best practices: Organize data in a centralized dashboard with columns for ad spend, engagement rates, and conversion estimates. Analyze trends weekly to identify spending peaks or drops. Focus on correlating financial data with campaign outcomes—e.g., high spend with low engagement may indicate inefficient strategies.
Turning Insights into Action: Strategic Financial Decision-Making
Transform Facebook competitor insights into actionable financial strategies with these practical steps:
Budget Allocation Framework
Analyze competitors' ad spend patterns from Facebook Ad Library. If rivals increase Q4 spending by 30%, allocate 25-35% of your budget to match market intensity while maintaining competitive positioning.
Investment Timing Strategy
Track seasonal spending trends. When competitors scale back (e.g., summer months), strategically increase your investment to capture market share at lower acquisition costs.
Market Shift Anticipation
Monitor competitor messaging changes. If multiple competitors shift to value-based pricing, prepare to adjust your pricing strategy and reallocate marketing funds accordingly.
Data-Driven Response Protocol
Create a decision matrix: When competitor ad frequency increases by 20%+, respond with 15% budget increase; when new product launches detected, allocate 10% of R&D budget to competitive analysis.
✅ ROI Optimization Checklist:
- Weekly review of competitor ad performance metrics
- Monthly budget reallocation based on competitive movements
- Quarterly competitive intelligence reports for strategic planning
- Real-time alert system for significant competitor financial shifts
Accelerate Your Competitive Intelligence
While manual Facebook analysis provides valuable insights, automating competitor tracking across multiple channels delivers comprehensive financial intelligence. RivalSense tracks competitor product launches, pricing updates, event participations, partnerships, and media mentions across company websites, social media, and various registries.
📈 Try RivalSense for free and get your first competitor report today to transform how you extract financial insights and make data-driven strategic decisions: https://rivalsense.co/
📚 Read more
👉 The Ultimate Luxury Fashion Partnership Compliance Checklist
👉 Leverage Competitor Pricing Insights for Strategic Partnership Termination
👉 OpenAI's New Developer Portal: What It Means for Your Competitive Strategy
👉 Business Partnership Value Creation: A Practical Guide with Actionable Steps
👉 Water Treatment Partnership ROI: Financial Analysis Case Study for Strategic Decision-Making